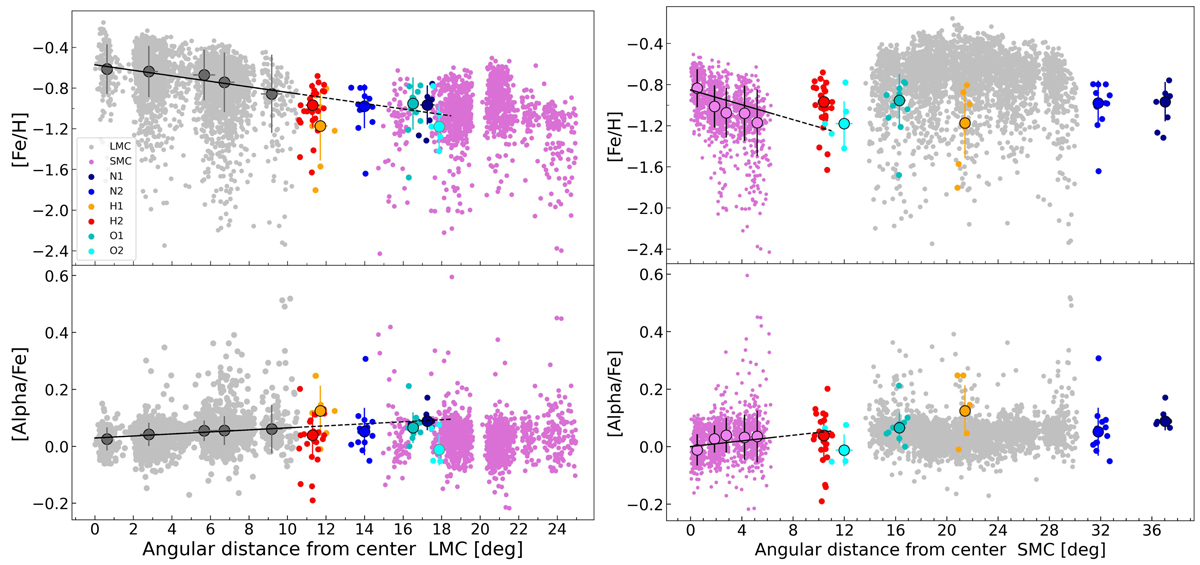
Fig. 6.
Download original image
Metallicity and α-abundance, defined here by [(Mg+Si+Ca)/Fe], radial profiles of our sample from the LMC center (left panel) and SMC center (right panel). Left panels: Median of each region listed in Table 2 (filled large symbols) and the standard deviation (error bars). The solid lines are linear fits made using the APOGEE-2 LMC data inside 11° extrapolated (dashed lines) to show the predicted values from the LMC to its outskirts, where our six APOGEE fields lie (also shown with color-coded points). Right panels: Median values for each region listed in Table 2 (filled large symbols; the error bars represent the standard deviation). The solid lines are linear fits made using the APOGEE SMC data inside 6° extrapolated to show the predicted values from the SMC out to where our six APOGEE fields.
Current usage metrics show cumulative count of Article Views (full-text article views including HTML views, PDF and ePub downloads, according to the available data) and Abstracts Views on Vision4Press platform.
Data correspond to usage on the plateform after 2015. The current usage metrics is available 48-96 hours after online publication and is updated daily on week days.
Initial download of the metrics may take a while.