Open Access
Fig. 5.
Download original image
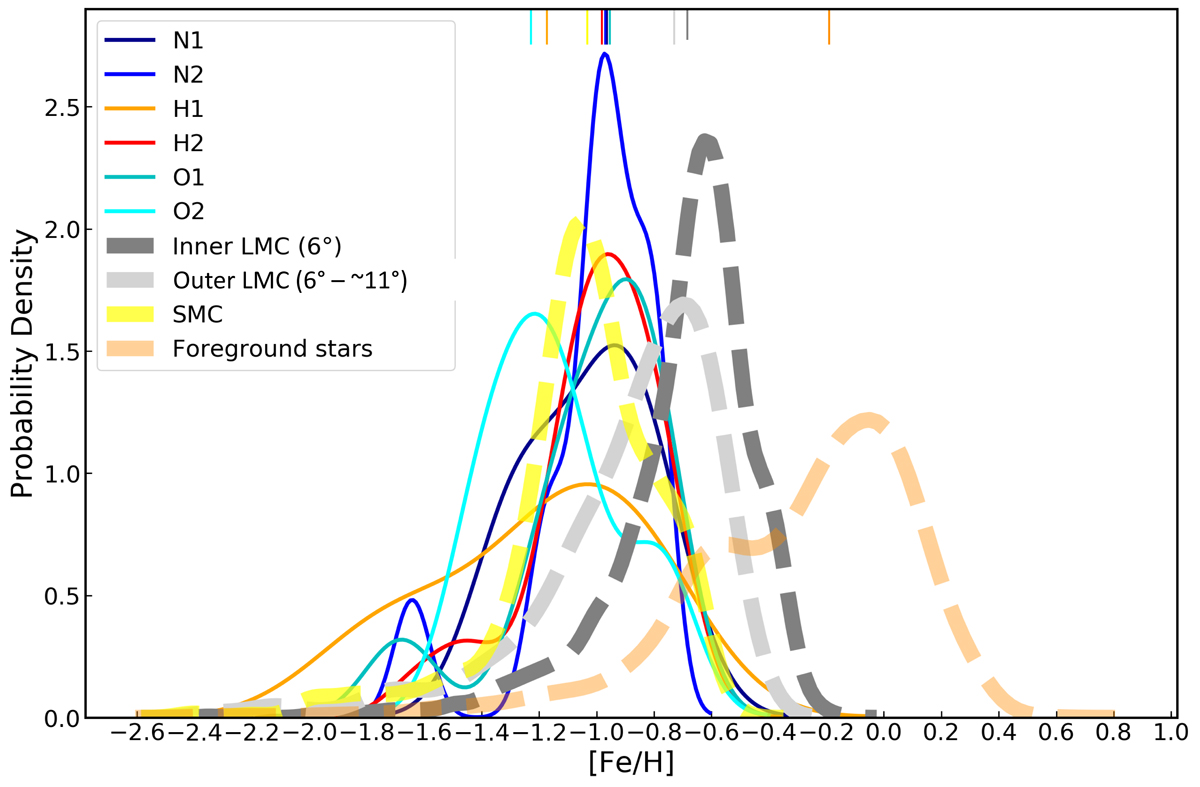
Normalized probability density functions applied to the observed metallicities in each region listed in Table 2, and including APOGEE measurements of more interior parts of the LMC and the SMC. The median metallicity for each region is indicated by a line at the top of the figure.
Current usage metrics show cumulative count of Article Views (full-text article views including HTML views, PDF and ePub downloads, according to the available data) and Abstracts Views on Vision4Press platform.
Data correspond to usage on the plateform after 2015. The current usage metrics is available 48-96 hours after online publication and is updated daily on week days.
Initial download of the metrics may take a while.