Fig. 4.
Download original image
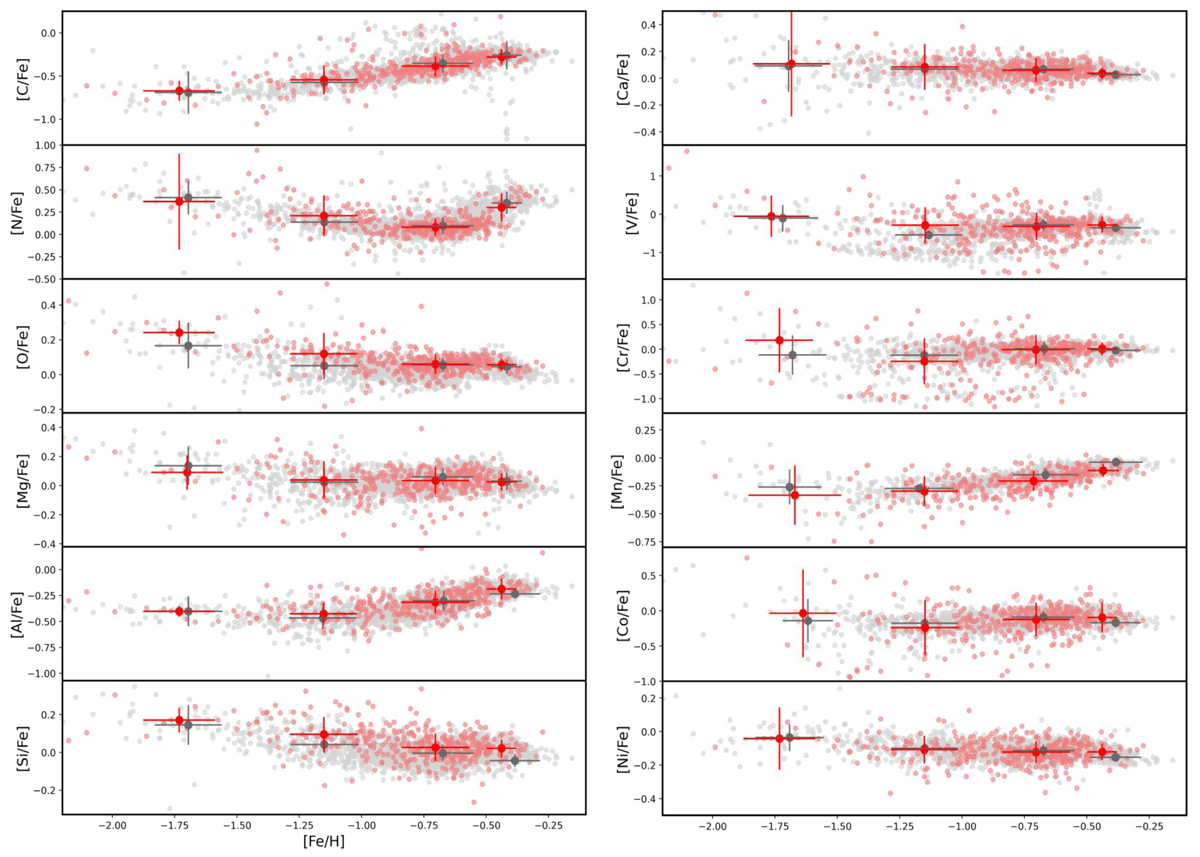
Comparison of the APOGEE-2 LMC stars with different S/N. The small red dots are stars with S/N between 35 and 70, and the small gray dots represent stars with S/N > 70. We divided the sample, according to metallicity, into four groups over the range −2.0 to 0.0 dex to obtain the median and dispersion of the stars at different representative metallicities. The filled large red and gray circles with error bars respectively represent these values.
Current usage metrics show cumulative count of Article Views (full-text article views including HTML views, PDF and ePub downloads, according to the available data) and Abstracts Views on Vision4Press platform.
Data correspond to usage on the plateform after 2015. The current usage metrics is available 48-96 hours after online publication and is updated daily on week days.
Initial download of the metrics may take a while.