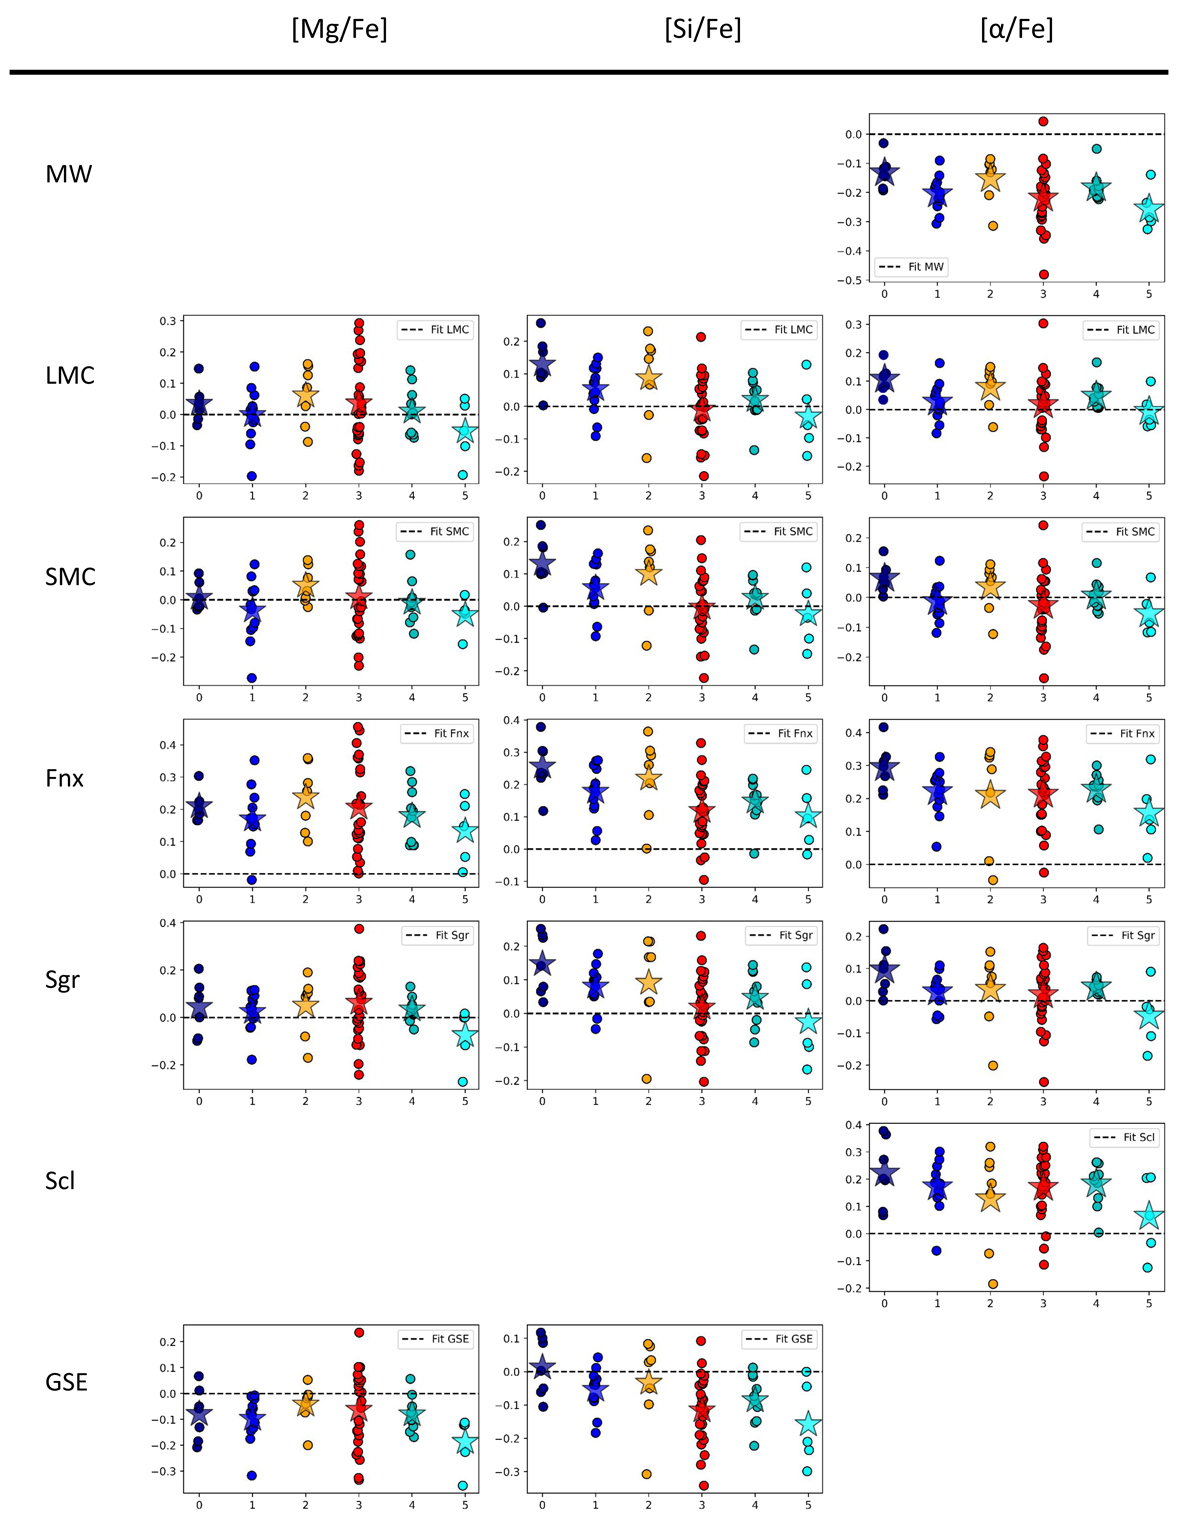
Fig. 15.
Download original image
Minimum orthogonal distance of each star from the six regions to the best fit for Mg-, Si-, and α-abundance vs. metallicity for each galaxy in Figs. 13 and 14 (MW, LMC, SMC, Fnx, Sgr, Scl, and GSE). The best fit was determined by Hasselquist et al. (2021) for Mg and Si, and by Nidever et al. (2020) for alpha-abundances. Each star from each region is represented by a filled circle and the mean for each region is represented by a filled star symbol (see Table 8).
Current usage metrics show cumulative count of Article Views (full-text article views including HTML views, PDF and ePub downloads, according to the available data) and Abstracts Views on Vision4Press platform.
Data correspond to usage on the plateform after 2015. The current usage metrics is available 48-96 hours after online publication and is updated daily on week days.
Initial download of the metrics may take a while.