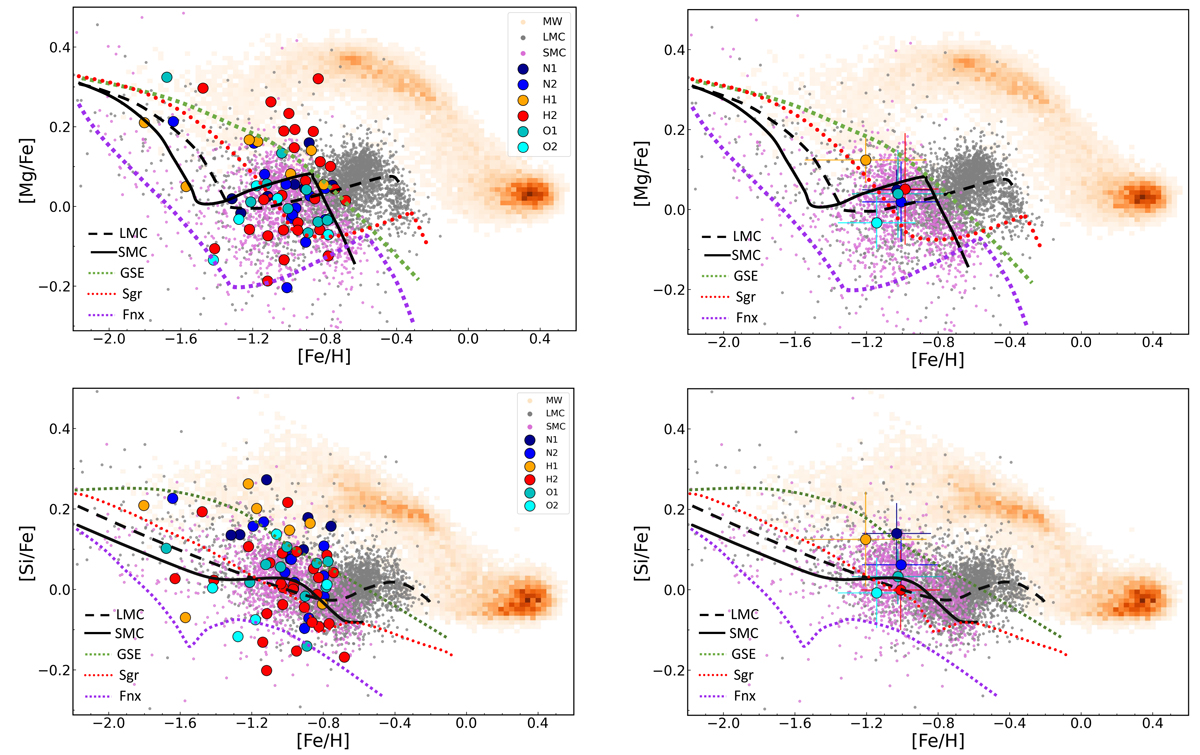
Fig. 13.
Download original image
Comparison of distributions of [Mg/Fe] (top panels) and [Si/Fe] (bottom panels) vs. [Fe/H] for our targeted MC substructure regions against those for large Milky Way satellites also using APOGEE data: the LMC, SMC, Sagittarius dSph, Fornax dSph, and the GSE. The left panels show individual stars for each substructure and the right panels show the mean and standard deviation for each substructure region. The overplotted lines show the chemical evolution track for each dwarf galaxy as determined by Hasselquist et al. (2021).
Current usage metrics show cumulative count of Article Views (full-text article views including HTML views, PDF and ePub downloads, according to the available data) and Abstracts Views on Vision4Press platform.
Data correspond to usage on the plateform after 2015. The current usage metrics is available 48-96 hours after online publication and is updated daily on week days.
Initial download of the metrics may take a while.