Fig. 4.
Download original image
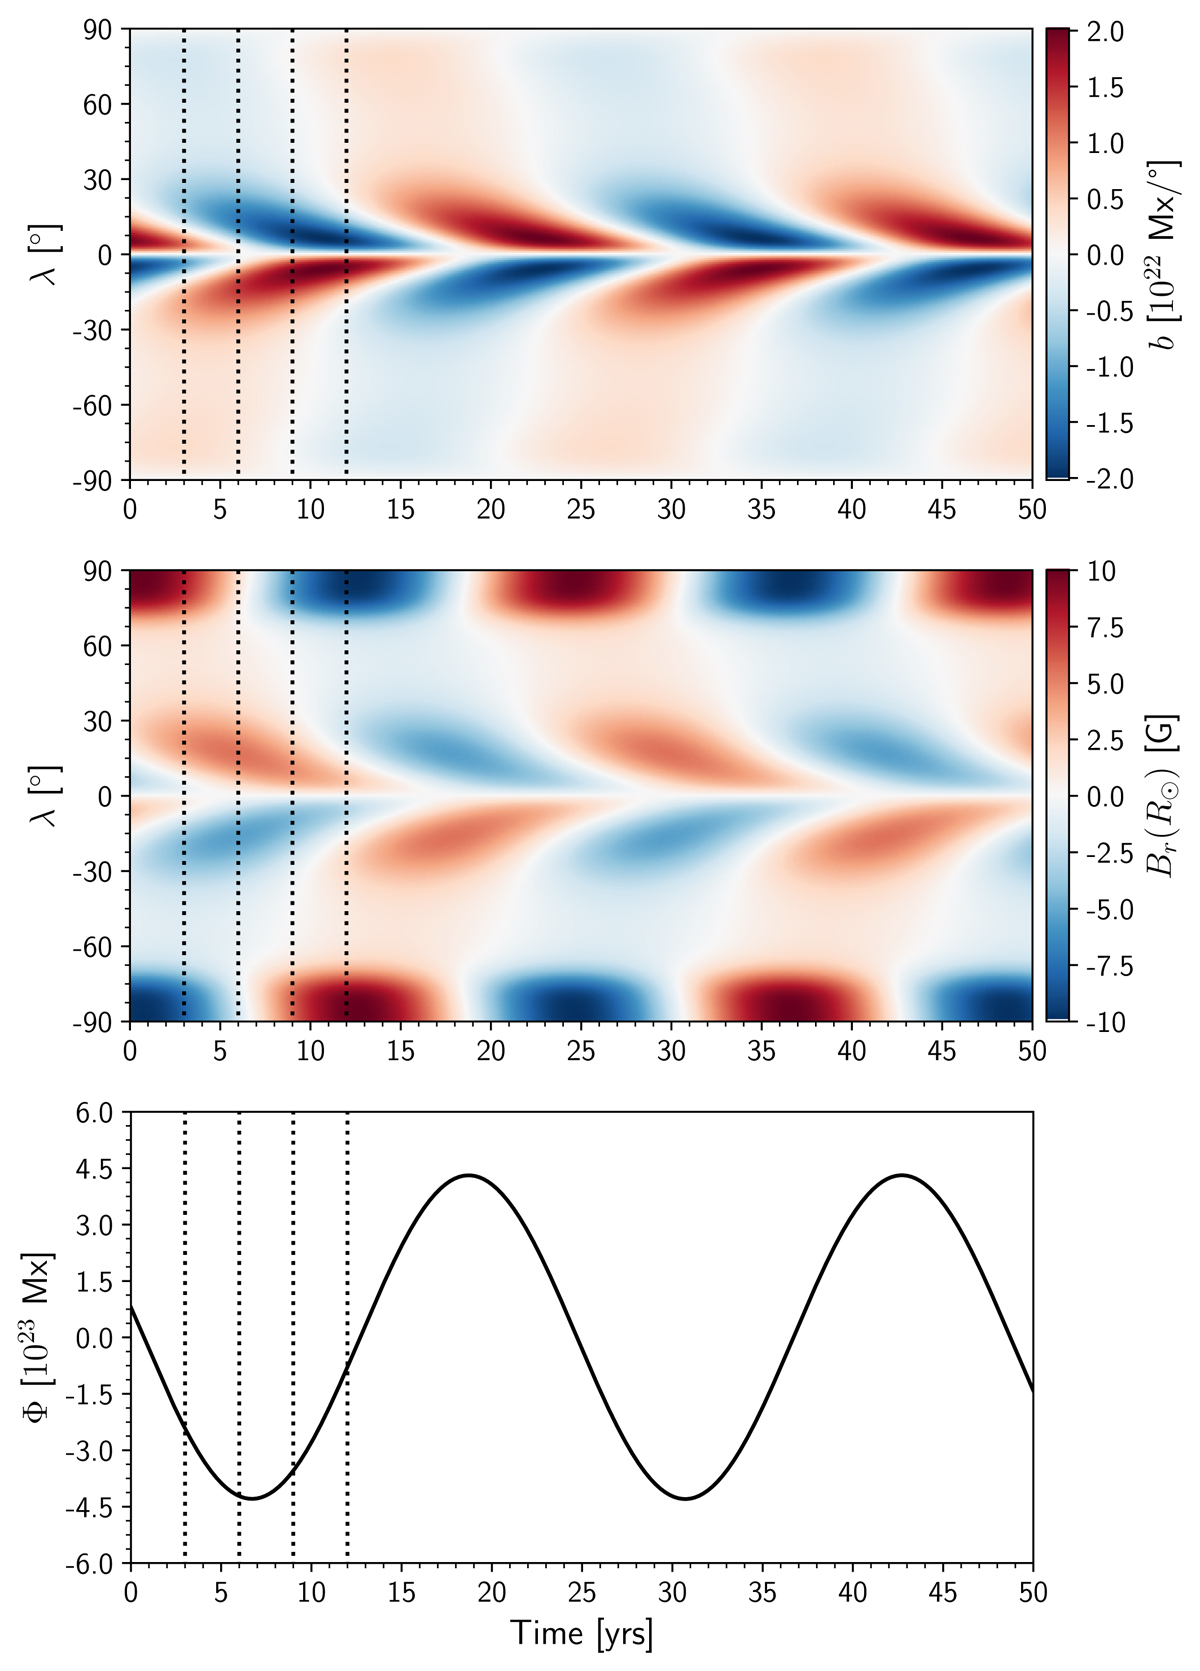
Time–latitude diagrams of the toroidal flux density b (top), surface radial field Br(R⊙) (middle), and the net toroidal flux in the northern hemisphere Φ (bottom) for the case without the flux loss associated with flux emergence (and with a period of 12 years and zero growth rate). The vertical dotted lines indicate the times where the snapshots of Fig. 5 were taken.
Current usage metrics show cumulative count of Article Views (full-text article views including HTML views, PDF and ePub downloads, according to the available data) and Abstracts Views on Vision4Press platform.
Data correspond to usage on the plateform after 2015. The current usage metrics is available 48-96 hours after online publication and is updated daily on week days.
Initial download of the metrics may take a while.