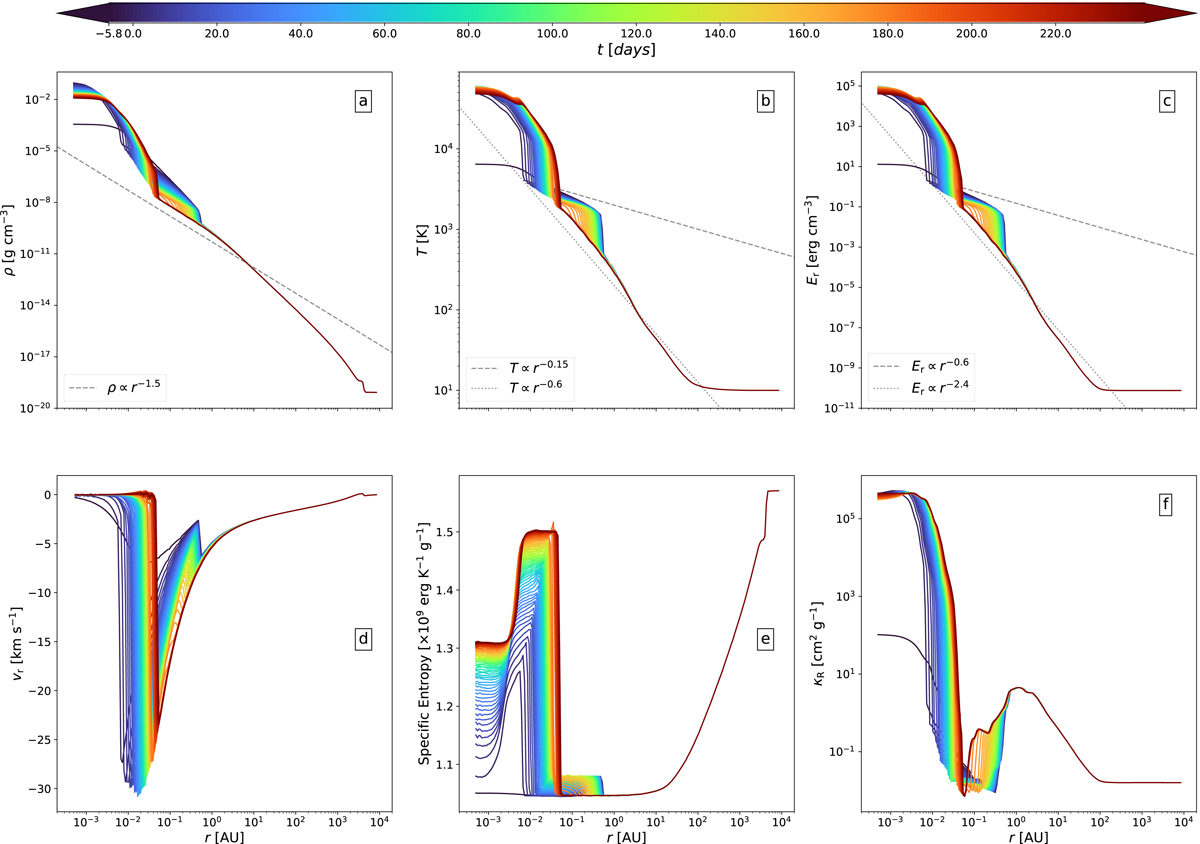
Fig. 6.
Download original image
Evolution of the density (panel a), temperature (panel b), radiative energy (panel c), radial velocity (panel d), specific entropy (panel e), and Rosseland mean opacity (panel f) profiles, averaged in radial bins and displayed as a function of radius for different times, where t = 0 marks the birth of the protostar. The last curves (dark red) on each panel correspond to t ≈ 241 days. The dashed and dotted gray lines in panels a–c are power law curves representing the expected density, temperature, and radiative energy profiles both prior to and after the accretion of the first Larson core.
Current usage metrics show cumulative count of Article Views (full-text article views including HTML views, PDF and ePub downloads, according to the available data) and Abstracts Views on Vision4Press platform.
Data correspond to usage on the plateform after 2015. The current usage metrics is available 48-96 hours after online publication and is updated daily on week days.
Initial download of the metrics may take a while.