Fig. 2.
Download original image
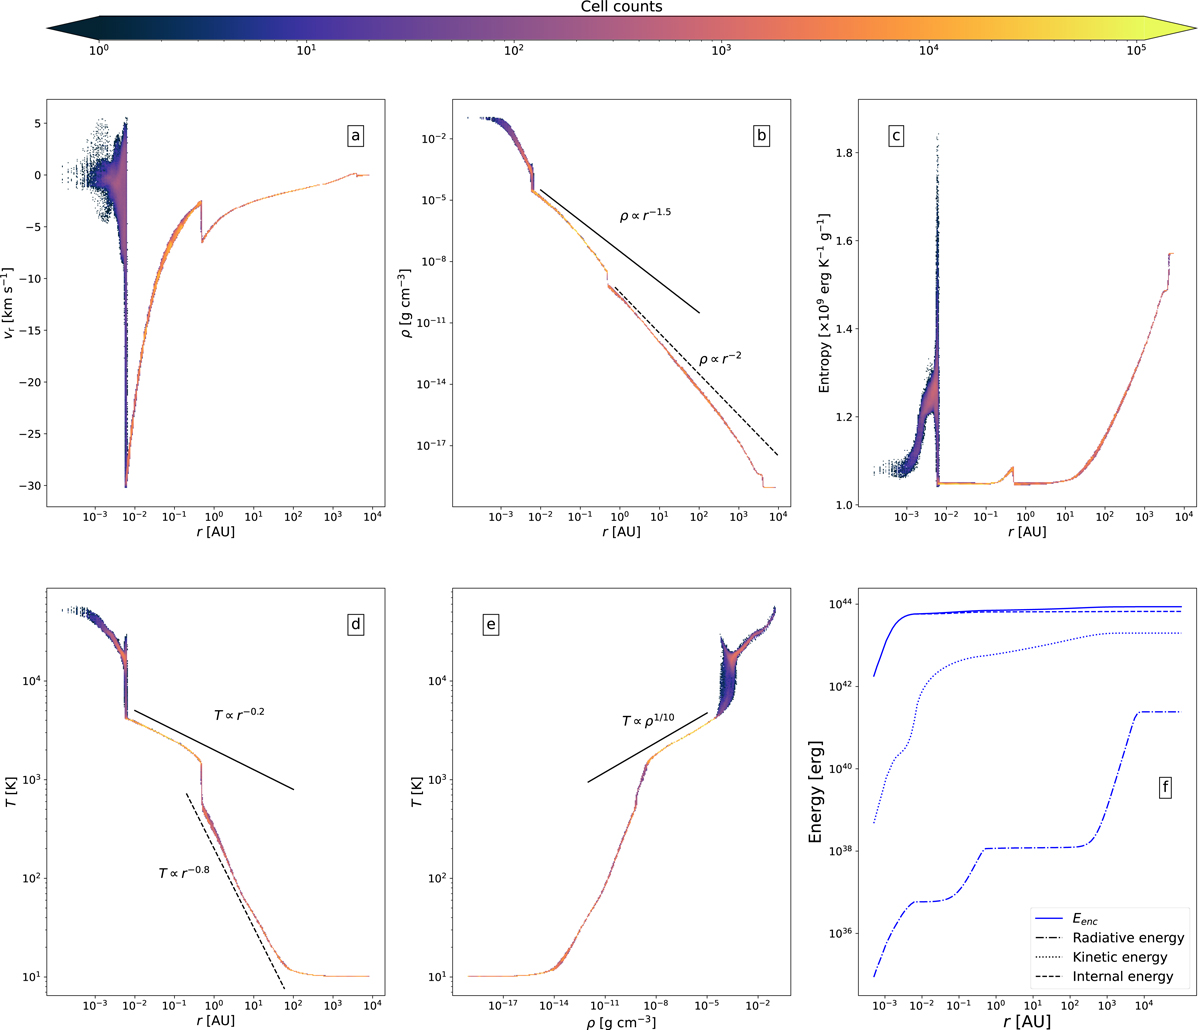
Various sets of 2D histograms binning the cells in our computational domain (panels a–e) at the epoch of protostellar birth. Panels a–d represent respectively radial velocity, density, entropy, and temperature as a function of radius. The solid (resp. dashed) black line in panel b displays the expected density profile for a free-falling gas (resp. for the collapse of an isothermal sphere). The solid (resp. dotted) black line in panel d represents the expected temperature profile for the collapse of an isothermal sphere with γeff = 1.1 (resp. γeff = 7/5). Panel e displays temperature as a function of density, where the overlaid solid black line displays a contraction with γeff = 1.1. Panel f represents the sum of the enclosed gas and radiative energies at radius r (solid line, see Eq. (15)), along with its constituent parts, namely internal (dashed line), kinetic (dotted line), and radiative energies (dash-dotted line).
Current usage metrics show cumulative count of Article Views (full-text article views including HTML views, PDF and ePub downloads, according to the available data) and Abstracts Views on Vision4Press platform.
Data correspond to usage on the plateform after 2015. The current usage metrics is available 48-96 hours after online publication and is updated daily on week days.
Initial download of the metrics may take a while.