Fig. 5.
Download original image
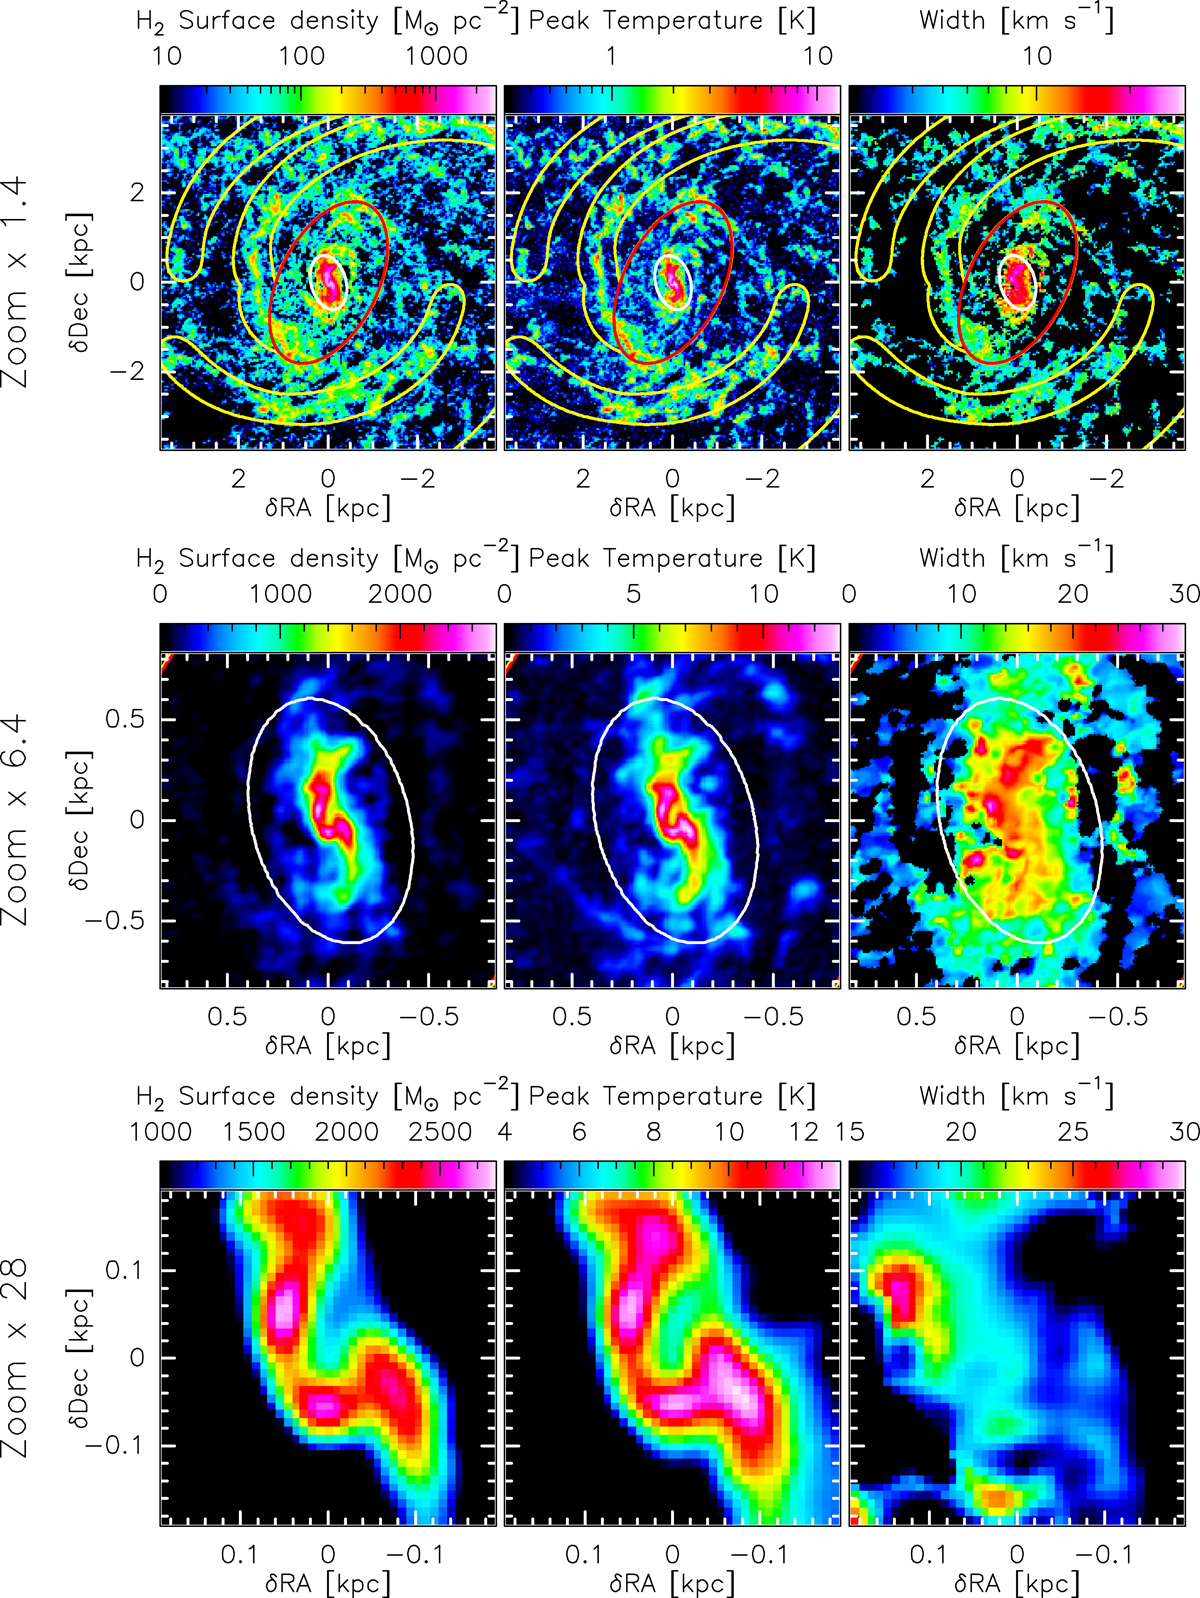
Zooms of the molecular surface density, peak temperature, and line width towards the galaxy center. The images have been deprojected from the galaxy inclination on the plane of sky, and then converted to kpc using a distance of 3.45 Mpc. The yellow lines show our spiral mask, while the red and white ellipses delimit the extent of the bar and center environment, respectively (see Appendix B.3 for the definition of these environment).
Current usage metrics show cumulative count of Article Views (full-text article views including HTML views, PDF and ePub downloads, according to the available data) and Abstracts Views on Vision4Press platform.
Data correspond to usage on the plateform after 2015. The current usage metrics is available 48-96 hours after online publication and is updated daily on week days.
Initial download of the metrics may take a while.