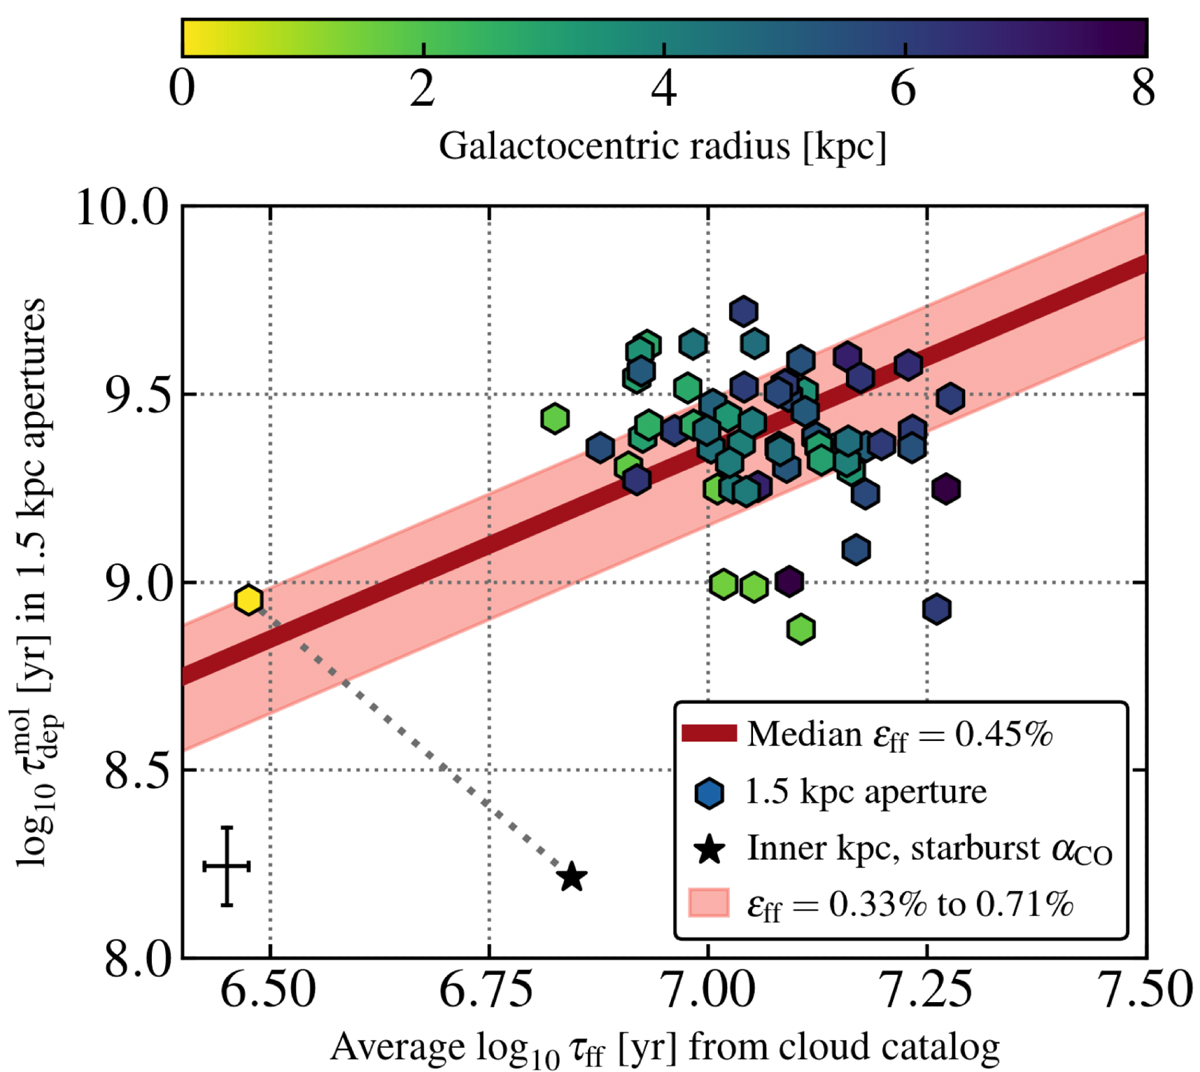
Fig. 4.
Download original image
Star formation efficiency per gravitational free-fall time in 1.5 kpc regions. Each hexagonal point shows the integrated molecular gas depletion time for a 1.5 kpc diameter region as a function of the mass-weighted average τff (see Eq. (4)) for 90 pc resolution clouds in that region. A straight, diagonal line in this space, such as the dark red one, corresponds to a fixed ϵff, which could be expected if density variations represent the primary drivers of depletion time variations. We color the regions by galactocentric radius and calculate the implied ϵff for each region. We estimate a median ϵff of 0.45% with a 16 − 84% range of 0.33 − 0.71%, and we illustrate these with the solid red line and shaded pink region. For the central 1.5 kpc region, we illustrate the effect of switching from our adopted Galactic αCO to a starburst conversion factor. The black cross shows a representative error bar as explained in the main text. The plotted values can be found in Table A.3.
Current usage metrics show cumulative count of Article Views (full-text article views including HTML views, PDF and ePub downloads, according to the available data) and Abstracts Views on Vision4Press platform.
Data correspond to usage on the plateform after 2015. The current usage metrics is available 48-96 hours after online publication and is updated daily on week days.
Initial download of the metrics may take a while.