Fig. 3.
Download original image
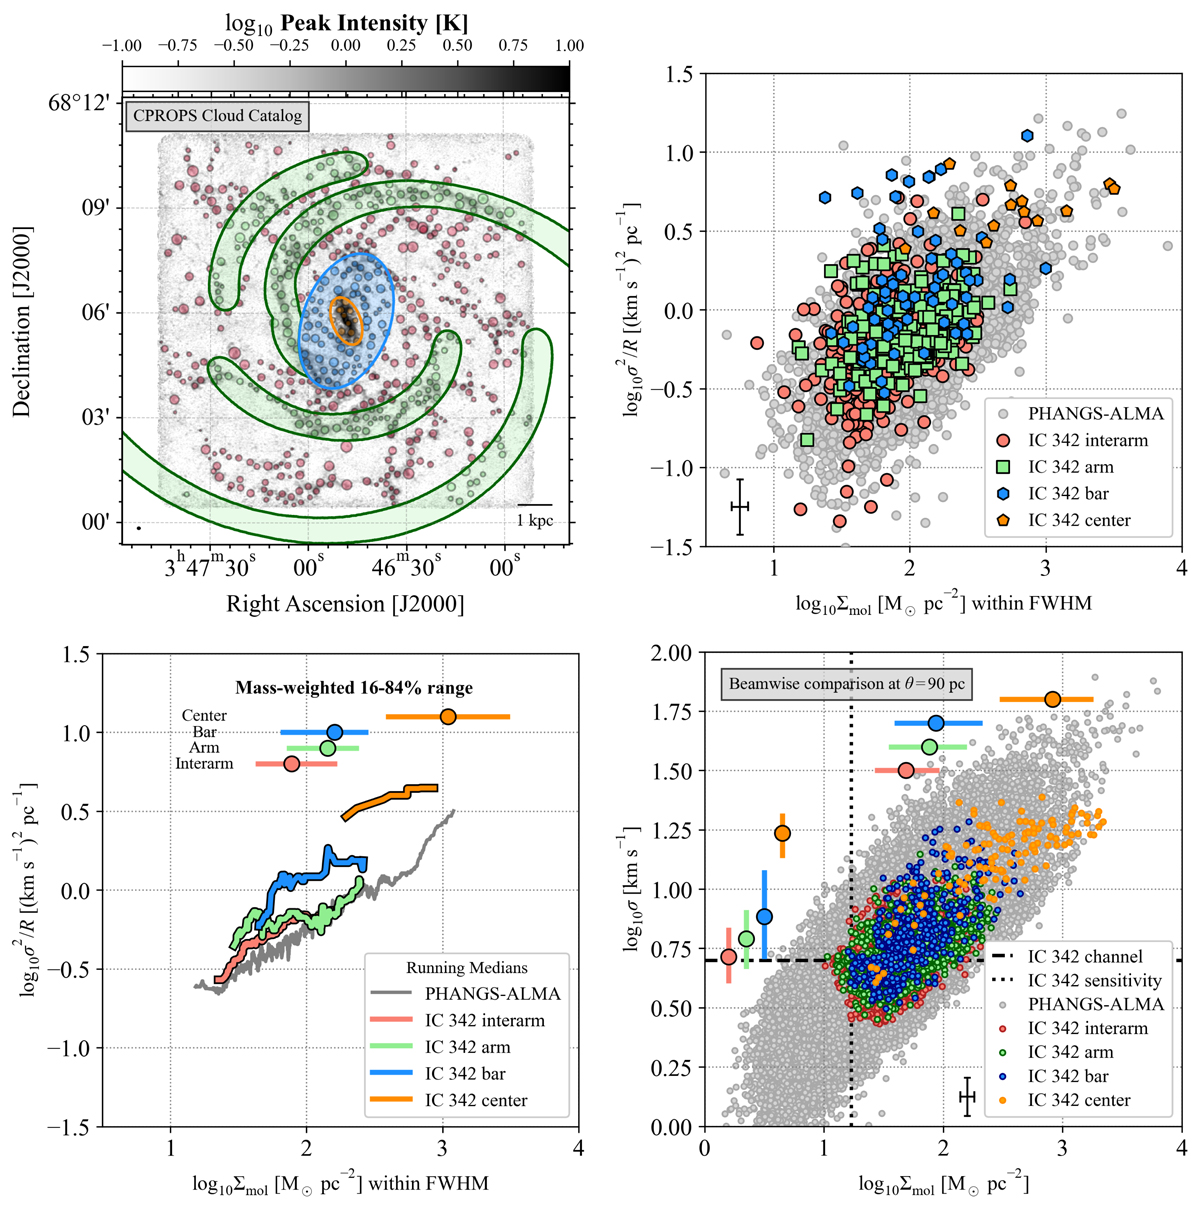
Giant molecular clouds or associations in IC 342. The top left panel shows the location of the molecular clouds that we catalog at 90 pc resolution. The size of each circle corresponds to the deconvolved radius and the color indicates which dynamical environment the cloud is assigned to (red shows interarm clouds, green arm cloud, and blue center clouds). The top right and bottom left panels show the cloud properties in σ2/R vs. Σmol space, in which clouds with a fixed virial parameter follow a diagonal line with a slope of unity in log–log space. Σmol is the average surface density within the FWHM size of each cloud, Σmol = MCO/(2πR2). We show the IC 342 clouds for each environment and clouds at the same resolution and sensitivity, but better velocity resolution, from PHANGS-ALMA (Rosolowsky et al. 2021, and Hughes et al., in prep.). The bottom left panel replaces individual clouds with running medians. The bottom right panel adopts a beam-wise approach in which each independent line of sight at a fixed 90 pc resolution supplies a measurement of line width and surface density (Sun et al. 2018, 2020b). Again we compare the IC 342 points to those from a large sample of PHANGS-ALMA galaxies and here we mark the channel width and approximate sensitivity limit for the IC 342 data with dashed lines (for a Gaussian CO line, FWHM = 2.35σ, so we always have more than one channel across the FWHM of the emission line). The bottom row also indicates the mass-weighted median (position of the color circles) and 16 − 84% range (span of the color horizontal or vertical line) for surface densities and line widths. These refer to the corresponding horizontal or vertical axis, with an arbitrary positioning along the perpendicular direction. The mass-weighted averages tend to lie at higher values than the bulk of the individual measurements because much of the molecular gas mass resides in a few high-mass clouds or associations. All panels tell a consistent story: arm clouds show mildly enhanced surface density and line width compared to inter-arm clouds, and the center shows significant enhancements in surface density and line width. The elevated line widths in the center indicate high virial parameters suggesting clouds with additional contributions to their line widths. The deviations from self-gravity virialization would be even more extreme if we adopted a CO-to-H2 conversion factor below the Galactic value used to construct these plots. The black crosses in the right panels show representative error bars for our measurements in IC 342, as explained in the main text.
Current usage metrics show cumulative count of Article Views (full-text article views including HTML views, PDF and ePub downloads, according to the available data) and Abstracts Views on Vision4Press platform.
Data correspond to usage on the plateform after 2015. The current usage metrics is available 48-96 hours after online publication and is updated daily on week days.
Initial download of the metrics may take a while.