Fig. 2.
Download original image
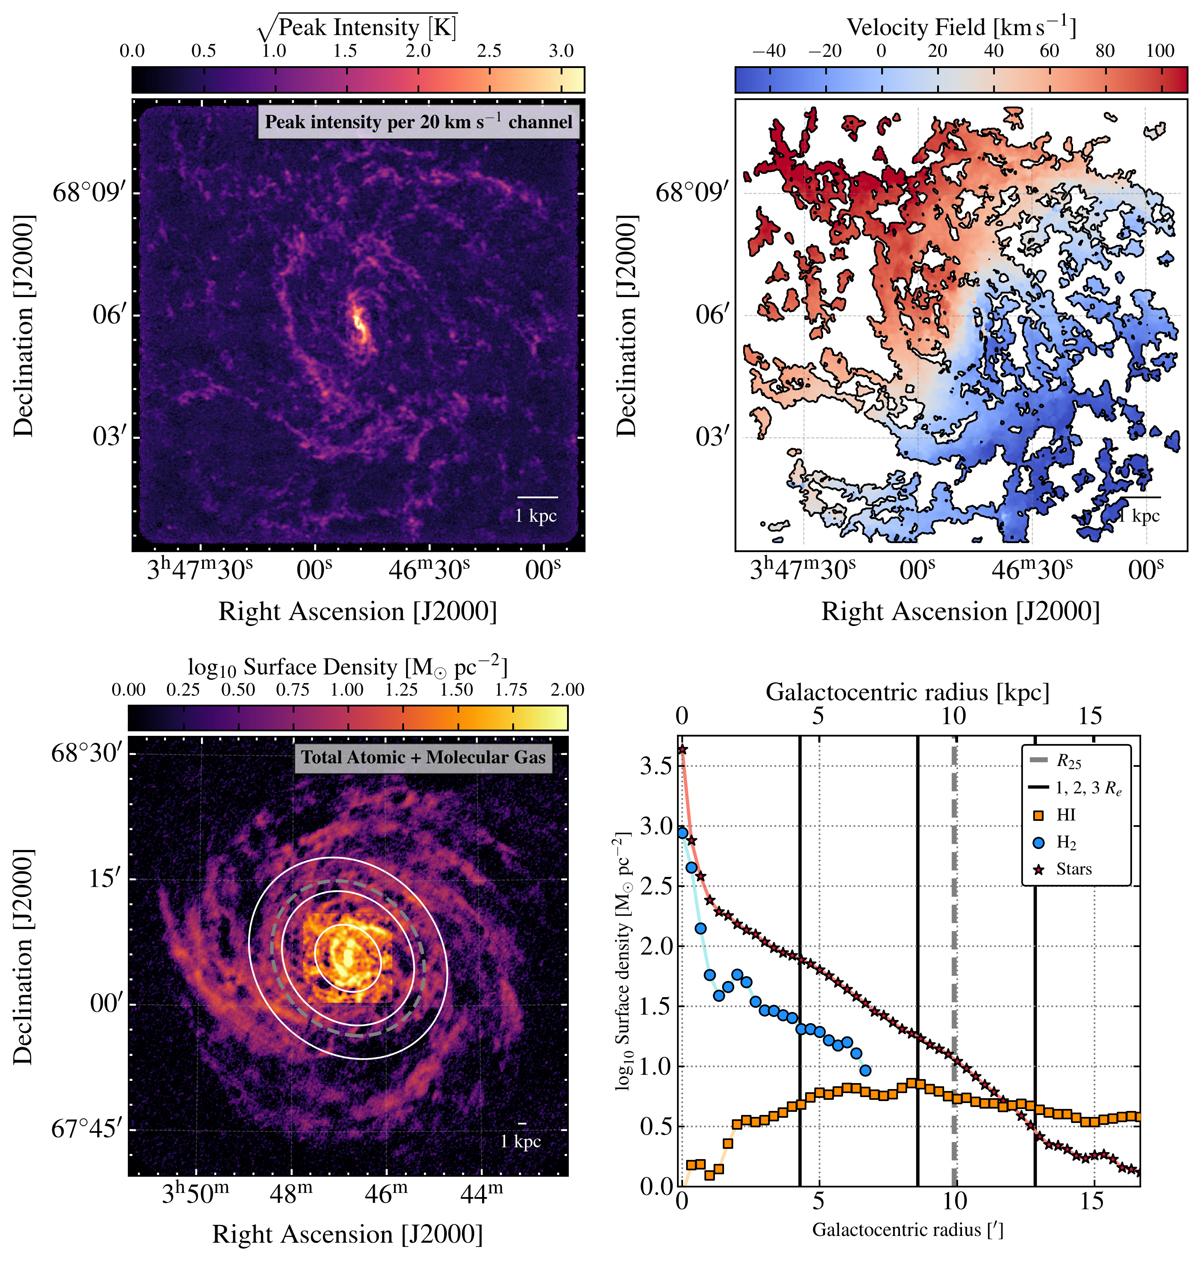
NOEMA survey of CO(1–0) emission from IC 342. The distribution of the CO(1–0) peak intensity at the native angular resolution (top left) and the intensity-weighted mean CO velocity at 90 pc resolution (top right) as revealed by our new CO survey. The images show spiral arms, abundant inter-arm emission, and a velocity field that mostly reflects a regularly rotating gas disk. The bottom panels show the molecular gas traced by CO in the context of atomic gas and stars. In these panels, the CO and H I data are shown at a common ∼350 pc resolution. The bottom left panel shows a map of the total neutral gas surface density adding molecular gas surface density to atomic gas surface density from Chiang et al. (2021). The white ellipses show 1, 2, 3 × Re and the gray dashed ellipse indicates 1 R25. The lower right panel shows the azimuthally averaged mass surface density profiles for atomic gas, molecular gas, and stellar mass estimated from the near-infrared. The stellar mass distribution using HST imaging is consistent with a nuclear star cluster and an exponential disk (Carson et al. 2015), while the presented profile suffers from the resolution of the WISE data. Our NOEMA survey covers the inner molecule-dominated region where the H I emission is depressed, including the CO-bright center.
Current usage metrics show cumulative count of Article Views (full-text article views including HTML views, PDF and ePub downloads, according to the available data) and Abstracts Views on Vision4Press platform.
Data correspond to usage on the plateform after 2015. The current usage metrics is available 48-96 hours after online publication and is updated daily on week days.
Initial download of the metrics may take a while.