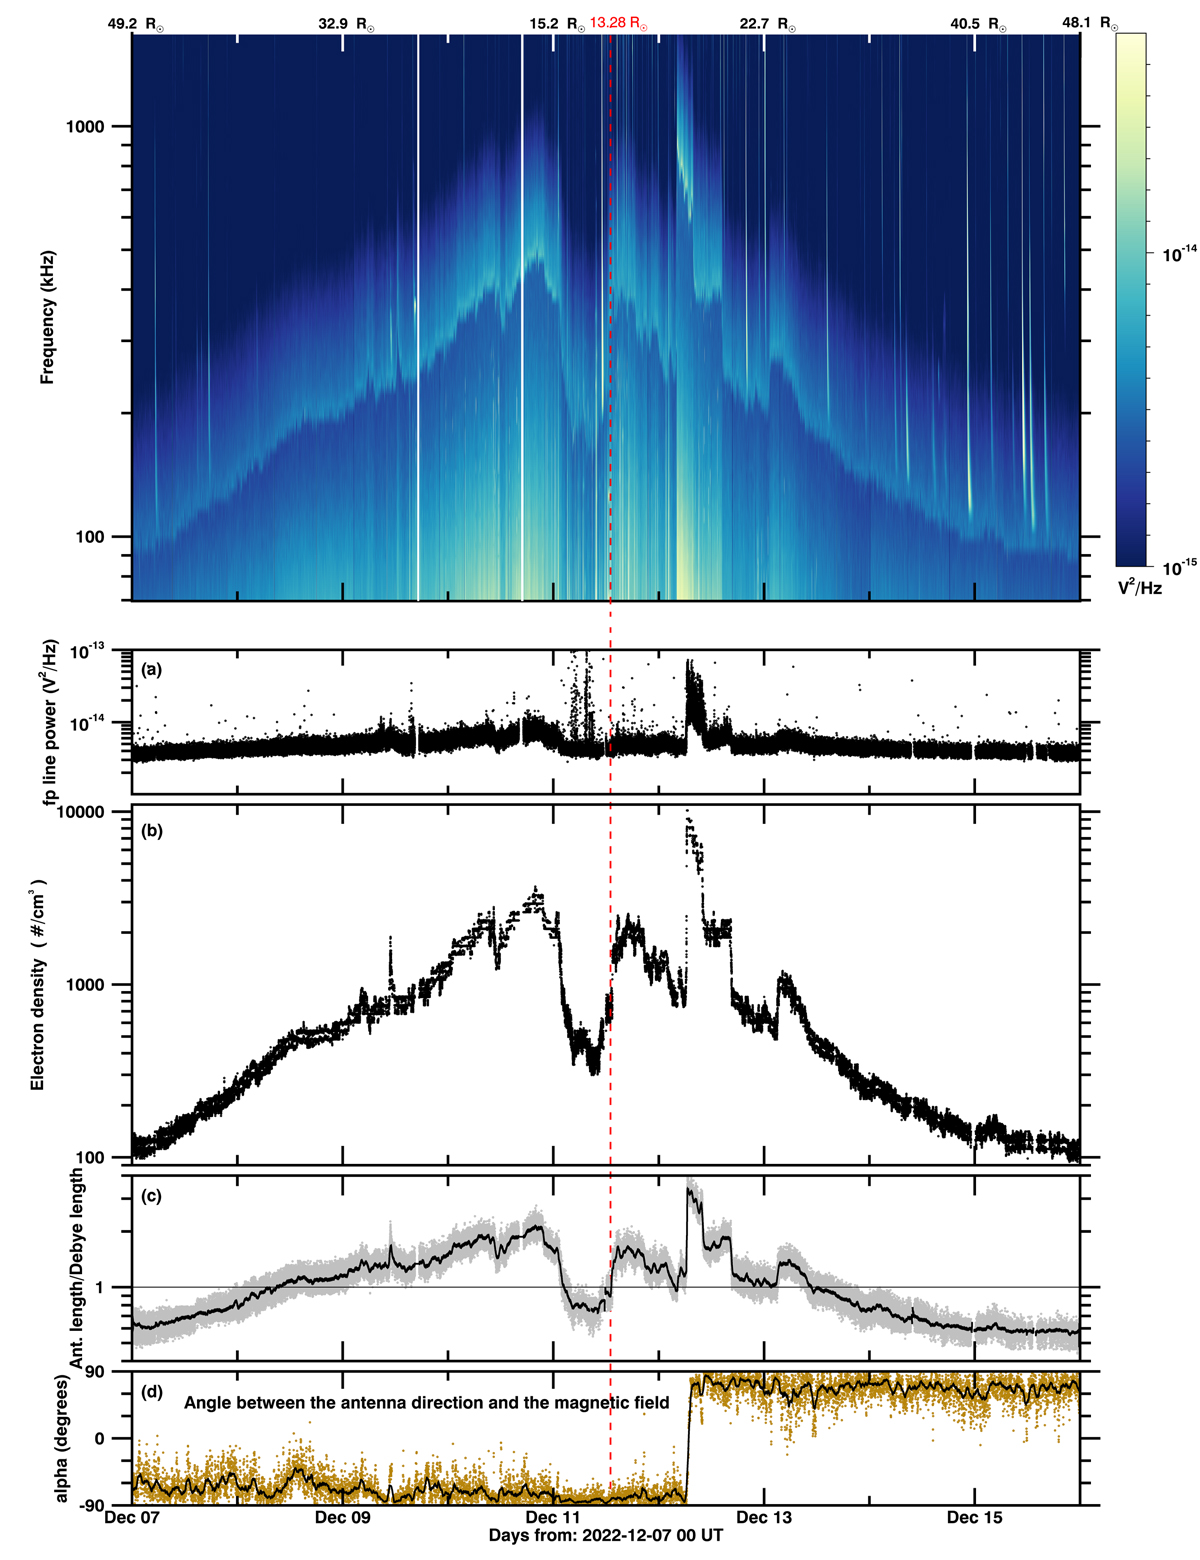
Fig. 4.
Download original image
Top panel: spectrogram acquired during the 14th PSP solar perihelion (closest solar distance 13.28 solar radii) with the FIELDS antenna, showing the plasma QTN, on which the fp line clearly emerges (cyan line varying between 90 kHz and 1 MHz). The heliocentric distance in solar radii is indicated at the top. Bottom panel: (a) spectral power at the peak, (b) total electron density, (c) ratio of the antenna length to the plasma Debye length, and (d) angle between the antenna direction and the magnetic field, showing a 180° variation at the heliospheric current sheet crossing (courtesy of FIELDS MAG). The superimposed black lines in panels c and d are one-hour rolling averages. The vertical dotted red line indicates the time of perihelion. The PSP spectrogram is available at https://research.ssl.berkeley.edu/data/psp/data/sci/fields/l2/rfs_lfr/2022/12/.
Current usage metrics show cumulative count of Article Views (full-text article views including HTML views, PDF and ePub downloads, according to the available data) and Abstracts Views on Vision4Press platform.
Data correspond to usage on the plateform after 2015. The current usage metrics is available 48-96 hours after online publication and is updated daily on week days.
Initial download of the metrics may take a while.