Fig. 2.
Download original image
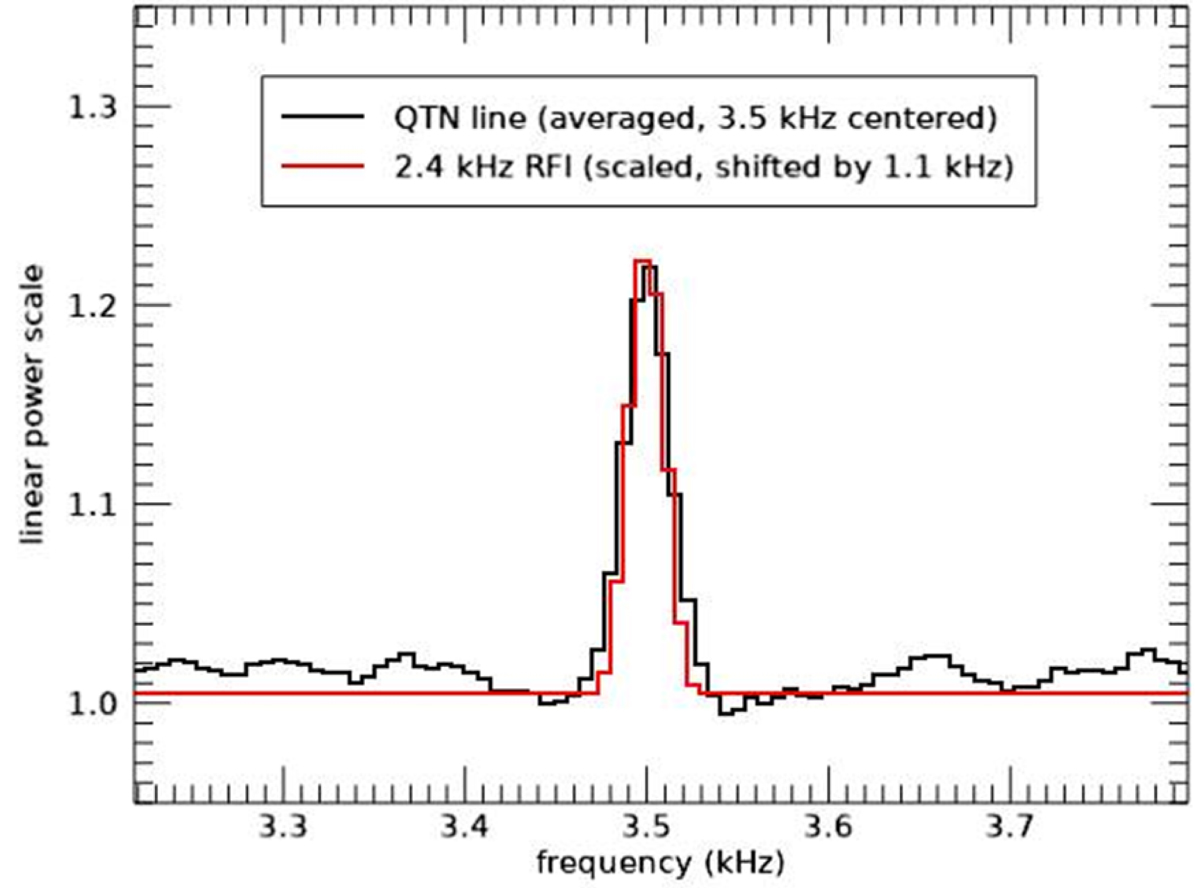
Observed fp line (in black, linear scale) superimposed on the supply interference line (in red) scaled in amplitude and shifted in frequency. The fp line profile was obtained by averaging 45 300 good-quality spectra which were shifted to a common central frequency, fitted to a Gaussian profile, and acquired within the period shown in Fig. 1. The total power exceeds the background by about 20%, which means that the contribution of the line amounts to roughly 20% of the background.
Current usage metrics show cumulative count of Article Views (full-text article views including HTML views, PDF and ePub downloads, according to the available data) and Abstracts Views on Vision4Press platform.
Data correspond to usage on the plateform after 2015. The current usage metrics is available 48-96 hours after online publication and is updated daily on week days.
Initial download of the metrics may take a while.