Open Access
Fig. 1.
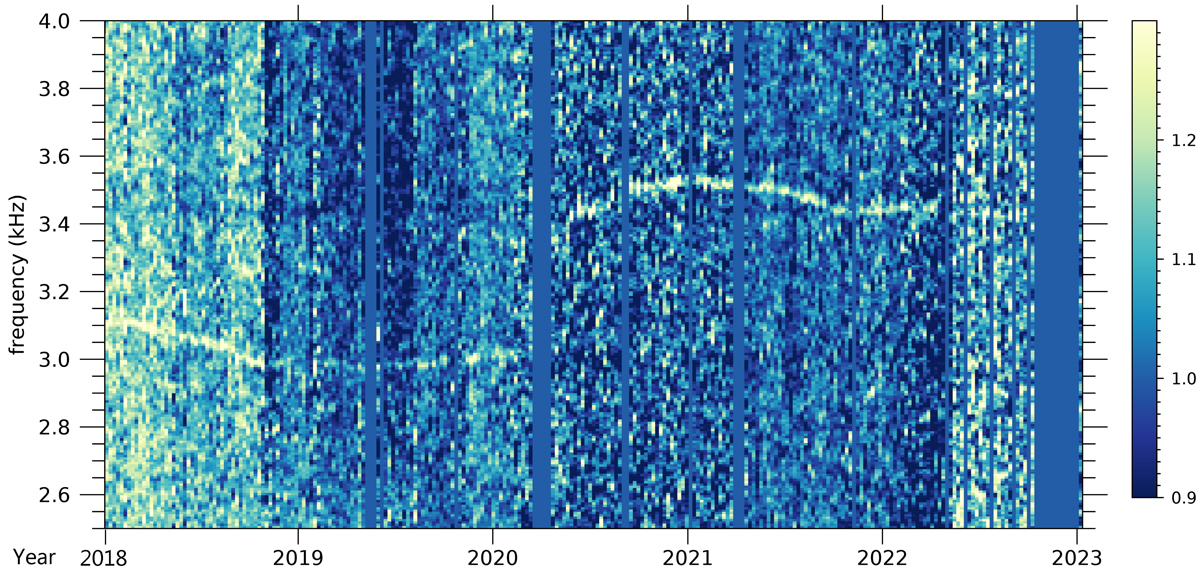
Download original image
Frequency–time spectrogram showing a portion of the weak continuous line previously published and its continuation from late 2020 until late 2022. The linear intensity scale is relative to the background level. The data from Voyager are available at https://pds.nasa.gov/.
Current usage metrics show cumulative count of Article Views (full-text article views including HTML views, PDF and ePub downloads, according to the available data) and Abstracts Views on Vision4Press platform.
Data correspond to usage on the plateform after 2015. The current usage metrics is available 48-96 hours after online publication and is updated daily on week days.
Initial download of the metrics may take a while.