| Issue |
A&A
Volume 679, November 2023
|
|
|---|---|---|
| Article Number | A2 | |
| Number of page(s) | 12 | |
| Section | Extragalactic astronomy | |
| DOI | https://doi.org/10.1051/0004-6361/202347239 | |
| Published online | 30 October 2023 | |
The compactness of ultra-faint dwarf galaxies: A new challenge?
Institute of Physics, Laboratory of Astrophysics, École Polytechnique Fédérale de Lausanne (EPFL), 1290 Sauverny, Switzerland
e-mail: yves.revaz@epfl.ch
Received:
20
June
2023
Accepted:
1
August
2023
So far, numerical simulations of ultra-faint dwarf galaxies (UFDs) have failed to properly reproduce the observed size–luminosity relation. In particular, no hydrodynamical simulation run has managed to form UFDs with a half-light radius as small as 30 pc, as seen in observations of several UFD candidates. We tackle this problem by developing a simple but numerically clean and powerful method in which predictions of the stellar content of UFDs from ΛCDM cosmological hydrodynamical simulations are combined with very high-resolution dark-matter-only runs. This method allows us to trace the buildup history of UFDs and to determine the impact of the merger of building-block objects on their final size. We find that, while no UFDs more compact than 20 pc can be formed, slightly larger systems are only reproduced if all member stars originate from the same initial mini-halo. However, this imposes that (i) the total virial mass is smaller than 3 × 10⁸ M⊙, and (ii) the stellar content prior to the end of the reionisation epoch is very compact (< 15 pc) and strongly gravitationally bound, which is a challenge for current hydrodynamical numerical simulations. If initial stellar building blocks are larger than 35 pc, the size of the UFD will extend to 80 pc. Finally, our study shows that UFDs keep strong imprints of their buildup history in the form of elongated or extended stellar halos. Those features can erroneously be interpreted as tidal signatures.
Key words: galaxies: dwarf / galaxies: formation / galaxies: evolution / methods: numerical
© The Authors 2023
 Open Access article, published by EDP Sciences, under the terms of the Creative Commons Attribution License (https://creativecommons.org/licenses/by/4.0), which permits unrestricted use, distribution, and reproduction in any medium, provided the original work is properly cited.
This article is published in open access under the Subscribe to Open model. Subscribe to A&A to support open access publication.
1. Introduction
Ultra-faint dwarf galaxies (UFDs) are the faintest galaxies known in the Universe, with, by definition, a V-band luminosity of fainter than LV = 105 L⊙, MV < −7.7 (see Simon 2019). Among them, some can be as faint as only a few hundred times solar, like Triangulum II (Laevens et al. 2015; Kirby et al. 2015), Segue I (Belokurov et al. 2007), or Segue II (Belokurov et al. 2009). UFDs are dominated by very old, that is, > 10 Gyr1 (Okamoto et al. 2012; Brown et al. 2012), and metal-poor ([Fe/H] ≅ −2 to −3) (Muñoz et al. 2006; Martin et al. 2007; Simon & Geha 2007; Kirby et al. 2008; Fu et al. 2023) stellar populations. Their structural properties and morphology have now been debated for over 15 years. It has been quickly shown that UFDs are rather elongated systems (Martin et al. 2008) with a mean ellipticity (ϵ) of about 0.4. Such a relatively elongated shape has been postulated to result from tidal interaction with the Milky Way (Martin et al. 2008; Sand et al. 2009; Longeard et al. 2022). Among the most extreme systems, Hercules (ϵ = 0.67) seems to be extended by a stream of stars (Sand et al. 2009; Roderick et al. 2015), a sign that it is a strongly tidally disrupted system. This conclusion is supported by tentative evidence of a velocity gradient (Adén et al. 2009). However, relying on three new star members, Longeard et al. (2023) were not able to confirm this gradient and concluded that Hercules does not show evidence of ongoing tidal disruption. Boötes I (ϵ = 0.68) is another example of an elongated UFD. In addition to a velocity gradient, Longeard et al. (2022) reveal the presence of a metallicity gradient, both suggesting that Boötes I may have also been affected by tides. On the other hand, Frebel et al. (2016) reported that Boötes I also displays two stellar populations, indicating that it could originate from different building-block objects. Another interesting morphological feature is the extended stellar halo of the Tucana II galaxy (Chiti et al. 2021) revealing either a strong bursty feedback process or an early galactic merger.
With an average size of less than 500 pc, UFDs are also the smallest galaxies known. However, compared to globular clusters, they exhibit a larger velocity dispersion of between 2 and nearly 10 km s−1 (Kleyna et al. 2005; Muñoz et al. 2006; Martin et al. 2007, 2016; Simon & Geha 2007; Simon 2019; Longeard et al. 2023) and a broader metallicity distribution. Combining their size and kinematics, and assuming they are self-gravitating systems at equilibrium, this makes UFDs the most dark-matter-dominated galactic systems in our Universe. As such, they constitute fundamental probes of the cosmological model (Bullock & Boylan-Kolchin 2017), with the ability to constrain the total matter power spectrum down to the smallest scales (Sanati et al. 2020).
Several groups have studied their formation and evolution in a Λcold dark matter (CDM) cosmological context using numerical schemes that include a complex treatment of the baryonic physics (Jeon et al. 2017, 2021b,a; Wheeler et al. 2019; Agertz et al. 2020; Applebaum et al. 2021; Orkney et al. 2021; Prgomet et al. 2022; Gandhi et al. 2022; Sanati et al. 2023). In these simulations, the rapid star formation quenching of UFDs is interpreted as a direct consequence of their very low potential well. Ionising photons emitted by young and massive stars – and responsible for the re-ionisation of the Universe during the first billions years – heat the cold and star forming gas expelled from the galaxy, causing the star formation to cease abruptly. UFDs are thus compatible with the first galaxies formed in mini-halos before the epoch of reionisation (EoR; Ricotti & Gnedin 2005; Wyithe & Loeb 2006; Salvadori & Ferrara 2009; Bovill & Ricotti 2009; Wheeler et al. 2019; Rodriguez Wimberly et al. 2019; Sanati et al. 2023).
While their luminosity, velocity dispersion, and star formation histories are relatively well reproduced by the aforementioned numerical simulations, some of their properties remain challenging to understand. One in particular is the metallicity distribution function and how it correlates with the luminosity through the metallicity–luminosity relation (Sanati et al. 2023; Fu et al. 2023). Numerical models predict that UFDs will contain much less metal than is suggested by observations at a given luminosity and fail to reproduce the presence of relatively metal-rich stars with [Fe/H] ≅ −1. Some attempts to solve this problem have been made by either assuming a metallicity-dependent IMF (Prgomet et al. 2022), a metallicity-dependent SNIa-rate (Gandhi et al. 2022), or an enrichment by pair-instability supernovae (Sanati et al. 2023). However, none of these solutions can fully solve the problem.
In addition to the metallicity–luminosity relation, the size–luminosity relation is also challenging. As described in detail in Sect. 2, most hydrodynamical models over-predict the size of UFDs and fail to reproduce the most compact observed ones.
In this paper we address this latter problem by tracing the size evolution of collisionless initially compact UFDs formed at the end of the EoR. We study their evolution in the framework of the ΛCDM paradigm where UFD buildup is predicted to be quite complex and will naturally affect their size.
The paper is organised as follows: In Sect. 2, we provide a detailed review of the discrepancy between the observed and simulated luminosity–size relation. In Sect. 3, we describe the numerical methods developed to study the size evolution of UFDs in a cosmological context. Our results are presented in Sect. 4. A discussion and conclusions are given in Sect. 5.
2. The challenge of the luminosity–size relation
Similarly to more massive galaxies, dwarf galaxies follow different scaling relations. The size–luminosity relation shows that brighter dwarfs are more extended than fainter ones. While this correlation has been well known for dwarfs for many years now (Kormendy 1985; McConnachie 2012), it is only recently that this relation has been extended to UFD galaxies (Simon 2019). In this relation, the size is conventionally represented by the 2D half-light radius R1/2 (also known as the effective radius), defined as the projected radius that contains half of the total luminosity of the galaxy. Figure 1 displays this relation for dwarf galaxies in the Local Group, including UFDs (grey squares). Data shown here are mostly taken from the continuously updated Local Group and Nearby Dwarf Galaxies database1 of McConnachie (2012). We supplement these data with recently discovered UFD candidates: Eridanus IV (Cerny et al. 2021), Boötes V, Leo Minor I, Virgo II (Cerny et al. 2023; Smith et al. 2023), Tucana B (Sand et al. 2022), Pegasus V (Collins et al. 2022), Leo M, and Leo K (McQuinn et al. 2023). A large fraction of UFDs (LV < 105 L⊙) are very compact with R1/2 smaller than 100 pc, with some extreme cases being more compact that 10 pc. Those observed galaxies are compared to predictions from a variety of numerical models shown by the coloured points (Jeon et al. 2017, 2021b; Revaz & Jablonka 2018; Applebaum et al. 2021; Agertz et al. 2020; Prgomet et al. 2022; Gutcke et al. 2022; Sanati et al. 2023). While simulations are in agreement with observations when above a luminosity of 105 L⊙, in the UFD regime, predictions diverge with several models, predicting a half-light radius of more than one order of magnitude above the observations. Except for the Jeon et al. (2021b) models, none are able to reproduce the compactness of observed UFDs. We note that in the Jeon et al. (2021b) star formation scheme, approximately ten gas particles are converted into stellar particles. With the resolution used, this process results in a stellar Pop II cluster with a mass of 500 M⊙. Consequently, models below 104 L⊙ are resolved with a maximum of 20 stellar particles (Myoungwon Jeon, priv. comm.), which can make the derivation of the half-light radius difficult.
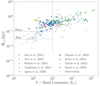 |
Fig. 1. Comparison of the luminosity–size relation for dwarfs and UFDs as derived from both observations and simulations. The grey squares represent our UFD sample (see text for details). Coloured points stand for different simulations published with the references given at the bottom of the figure. The vertical red dotted line separates UFDs from brighter dwarfs. |
The origin of the over-prediction of the size of UFDs remains elusive. To begin answering this question, it is important to decipher whether or not numerical issues could affect the sizes of simulated systems. (i) A lack of resolution could naturally be at the origin of this discrepancy. However, this argument by itself is not sufficient, as the Wheeler et al. (2019) model is the most resolved, with a 30 solar mass resolution, while being well above the relation. (ii) Spurious numerical heating is know to exist when collisionless particles with different masses are used for the stellar and dark matter components (Revaz & Jablonka 2018; Ludlow et al. 2019, 2021, 2023). This heating leads to an artificial increase in the stellar component. (iii) An over-estimation of the stellar feedback as well as a bursty star formation history could also lead to over-estimation of the size of the system. Nevertheless, we note that over-estimation of the sizes of UFDs seems to be a general trend, despite the use of a variety of numerical schemes and star formation and stellar feedback recipes.
Beyond numerical issues, one might ask whether or not the complex buildup history that any galaxy – including UFDs – suffers during its formation in the hierarchical ΛCDM model could be responsible for this tension. Both observations and models agree that UFDs are dominated by very old stars. According to numerical models, star formation is inhibited after those tiny galaxies have lost their gas at the end of the EoR. Consequently, being devoid of gas, UFDs evolve as collisionless systems during the remaining 12 Gyr or so up to the present time. Without dissipation, any perturbation to the stellar component formed prior to the EoR will lead to an increase in its size. In the following sections, we explore the extent to which the buildup of UFDs in a cosmological context can lead to oversized UFDs.
3. Methods and simulations
Here, we propose a new and numerically clean method that takes advantage of the fact that UFDs lost their gas at the end of the EoR. This fact allows us to assume that the stellar component of UFDs is in place at z = 6 and that UFDs further evolve as non-dissipative collisionless systems. This allows us to study their buildup history and its impact on their size using dark-matter-only (DMO) simulations. We followed Sanati et al. (2023) and tailored similar cosmological zoom-in simulations, but this time in a DMO regime with an increased resolution. In all simulations presented here, the dark matter particle mass is set to 77 M⊙, a factor 64 compared to Sanati et al. (2023). Simulations were run with the code SWIFT2 (Schaller et al. 2016, 2018, 2023), a modern gravity and smoothed-particle hydrodynamics solver for astrophysical and cosmological applications that benefits from a task-based parallelism. From z = 70 down to z = 2.8, we used a co-moving gravitational softening length of 35 pc. This is further kept constant to 9.3 pc down to z = 0 in physical coordinates. We simulated a subset of 7 halos among the 18 studied by Sanati et al. (2023) that led to the formation of UFDs. We choose the ones that have the faintest stellar component, for which the size discrepancy between observations and simulations is the greatest. Table 1 shows the properties of those halos at z = 0 as derived from Sanati et al. (2023): luminosity, stellar mass, virial mass, radius, half-light radius, and velocity dispersion.
Global properties of the seven simulated halos taken from Sanati et al. (2023).
To estimate the effect of the buildup history on the size of UFDs measured from the stellar component, which is absent from our DMO simulations, we used the following approach: (i) extract UFDs at z = 0, (ii) find progenitor subhalos at z = 6 (see Sect. 3.2 for a proper definition of subhalos), (iii) determine the stellar content and properties of each subhalo, (iv) track the evolution of the stellar content, in particular its size, while assembling the UFDs, down to z = 0. Each step is detailed below.
3.1. Main halo extraction
For each DMO zoom-in simulation, the main halo, that is, the one that hosts the UFDs at z = 0, is found using the position of the corresponding halo from the lower-resolution hydrodynamics runs of Sanati et al. (2023). All dark matter particles inside the virial radius are extracted.
3.2. Subhalo extraction
Relying on their IDs, those main halo DM particles are extracted from the entire cosmological box at z = 6. As the final main halo is not in place at this redshift (see Sect. 4.1), these particles define a subset of halos; we call them DMO subhalos. We define subhalos as clusters of particles for which the virial radius can be determined, that is, concentration of matter with a mean density larger than 200 times the critical density. Particles belonging to the main halo but not part of subhalos are ignored.
3.3. Stellar mass determination
We take advantage of the hydrodynamics runs to determine the stellar content of our DMO subhalos. Firstly, following the exact same method as the one used for the DMO runs3, we extracted subhalos at z = 6 from the hydrodynamics runs. Some of those halos – usually the most massive ones – contain stellar particles that will contribute to the formation of the stellar content of the UFD at z = 0. For each subhalo i, we record the number of stellar particles it contains, N⋆,i,hydro, whereby completely dark halos have N⋆,i,hydro = 0. Secondly, we cross-match the DMO and hydrodynamics subhalos to find corresponding halo pairs. As the two simulations differ in their resolution and baryonic content, both the position and the mass of halos can vary slightly (Garrison-Kimmel et al. 2017), necessitating some care in the identification of those pairs. Knowing the position of all halos as well as their mass, we identified corresponding halos by minimising a norm in configuration space and checking that their halo mass corresponds. A final visual check was carried out to guaranty the perfect match. We find that, on average, halos are slightly globally shifted between the two runs. We then attribute an associated number of stellar particles N⋆, i to each DMO subhalo using a conversion factor f⋆, such that N⋆,i = int(f⋆ · N⋆,i,hydro). Finally, for each subhalo i, we find the N⋆, i most gravitationally bound DM particles, which we further considered as stellar particles, conserving their properties at the time of selection, that is, their position, velocity, and mass. This is done by (i) extracting only particles within the virial radius of each subhalo and (ii) computing their total energy with respect to the subhalo. The energy Ej, i of each particle j is written as:
where  is the mean velocity of the halo i and Φj, i is the potential energy of the particle j considering only the mass in the virial radius. The N⋆, i most gravitationally bound particles are then the ones with minimal energy. These are assumed to represent the stellar content of the subhalo and are referred to here as a cluster. We note that through this procedure, we maximise the compactness and robustness with respect to gravitational perturbations of the stellar cluster defined. This is an important choice, and is further discussed below.
The value of the factor f⋆ can be modified to vary the number of particles representing a cluster while keeping the same ratio between them, that is, the stellar content as determined by the hydro-runs. Its fiducial value f⋆,fid is set to 32, that is, we define 32 times more particles compared to the number of stellar particles4 found in a subhalo in the lower-resolution hydrodynamics run. This number is motivated by the current resolution, which leads an increase of 64 (in term of number of particles) compared to the Sanati et al. (2023) simulations. However, it must be borne in mind that those particles do not precisely represent stars but are used as mass tracers. As we show below, our fiducial choice also guarantees a sufficiently large number of tracers, which is essential in order to properly define cluster size and obtain statistically significant results. The impact of varying f⋆ is studied in Sect. 4.4. We also note that, as cluster particles are initially DM particles, their number, within each cluster, scales with the cluster mass.
3.4. Tracking the evolution of clusters
Once clusters have been defined at z = 6 as the most gravitationally bound DM particles, we can easily trace their properties throughout the evolution of the formation of the UFDs. To this purpose, they are extracted from the 878 snapshots saved between z = 6 and z = 0. We computed their mass and velocity centres as well as their 2D half mass. As UFDs are composed exclusively of old stars (Brown et al. 2012), the mass-to-light ratio is constant and the half mass can replace the half light to a very high level of accuracy. This half mass is denoted R1/2. To accurately determine its value, we used two methods. In the first, we took advantage of the Plummer model property for which the scale radius parameter is precisely the 2D half-mass radius. We then computed the surface density of the cluster assuming cylindrical symmetry and fit it with a Plummer model to determine the scale radius that provides a good estimation of R1/2. In the second method, we computed the cumulative mass profile through a logarithmic grid, also assuming cylindrical symmetry, and determined the radius where the value is half of the maximum. In both methods, in order to avoid bias owing to a specific choice of line-of-sight, we averaged the result obtained using seven random lines of sight. As no major differences were found between the two methods, we used the second one.
We finally emphasise here that, by using DMO simulations, all particles share the same mass. This avoids the aforementioned numerical bias where stellar particles with smaller masses are numerically heated up by more massive dark matter ones (Revaz & Jablonka 2018; Ludlow et al. 2019, 2021, 2023); this is an essential factor in providing reliable cluster sizes.
4. Results
4.1. Subhalo properties at z = 6
Figure 2 shows the relative position of the selected clusters at z = 6 for each of the seven simulated UFDs. Each cluster is displayed with a specific colour and over-plotted on top of the surface density of the DM. All figures are centred on the mass-dominant cluster, which is the one that contains the largest number of particles and therefore the most mass, and is marked in red. The list of clusters is provided in the upper right legend, together with the number of particles it contains. This number reflects the stellar particle mass found in the hydrodynamics run; its absolute value depends on the parameter f⋆.
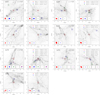 |
Fig. 2. Relative positions of the selected clusters at z = 6 for each of the seven UFDs simulated. Clusters are indicated with a specific colour on top of the DM surface density in grey. Red ones correspond to the clusters containing the largest numbers of particles. The subpanels at the bottom show the projection in proper coordinates (100 pc × 100 pc) of each cluster. For each UFD, we show two different projections. |
It is striking from this figure that, at z = 6, which is the end of the EoR and also corresponds to the end of the star formation history of UFDs, none of the seven studied systems is in place. On the contrary, clusters that will form a dwarf at z = 0 are spread out and are fully dynamically disconnected, with relative distances that extend up to 130 ckpc (h291). We recall that from this redshift down to z = 0, those stellar clusters will not dissipate energy except through dynamical friction. This underlines the difficulty those clusters – spread out in physically distinct mini-halos – may face in order to end up forming very compact systems, such as the observed UFDs.
In the seven simulated halos, the number of identified clusters ranges from two (h315, h291) to five (h170, h273) (see Table 2). This number correlates with the virial mass at z = 0. More massive halos, such as h170 (M200 = 8.3 × 10⁸ M⊙), are made up of five clusters, while low-mass halos (h323, h315, M200 < 4.5 × 10⁸ M⊙) have only two. This naturally reflects the hierarchical buildup of the ΛCDM paradigm. The probability that more massive halos form from more massive subhalos that contain stars is larger than for less massive ones. We note that following our choice of f⋆,fid, each cluster contains a relatively large number of particles – that is, from 40 to 2556 –, which is essential in order to obtain reliable and accurate properties during their evolution. The shape of the extracted clusters is shown at the bottom of each panel of Fig. 2, where particles are projected in a 100 pc × 100 pc box in proper coordinates. The size of each cluster (R1/2,init) is given in Table 2. We note that except for model h291, which is discussed in Sect. 4.2.1, they are all relatively spherical and compact, with a half mass of less than or roughly equal to 25 − 30 pc. We find all clusters to be isotropic in velocity space with rather low line-of-sight velocity dispersions, ranging between 0.95 and 2.2 km s−1. Those cluster properties validate our selection method.
Properties of the seven halos in the DMO run.
4.2. The buildup
The left panels of Figs. 3 and 4 show the time evolution of cluster size traced by their half-mass radius, shown as a function of redshift. The red curves correspond to the mass-dominant clusters. The sizes of the formed UFDs at z = 0 (R1/2,fin) are given in Table 2, and are drawn as the black horizontal curve. All clusters have a size above the resolution of the gravity force, which is shown by the dotted lines. This guarantees safe numerical treatment and prevents uncontrolled heating by two-body relaxation. With our choice of f⋆,fid, which favours a larger number of particles in clusters, and consequently a larger initial size, no cluster is initially found with a half mass of less than 10 pc. In Sect. 4.4, we show the influence of decreasing the number of particles in clusters on their size. Figure 5 complements Figs. 3 and 4 by showing the time evolution of the virial mass of the halo that hosts the main cluster and corresponds to the halo of the final UFD.
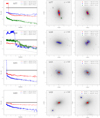 |
Fig. 3. Buildup history of UFDs and their final shape. Left: evolution of cluster size in proper units for the four models h277, h249, h315, and h323. Each line corresponds to one cluster and follows the colour code of Fig. 2, the red one being the main cluster, defined as the one with the largest number of particles. The dotted line at the bottom of the plot indicates the resolution of the simulation, i.e. the gravitational softening length. The horizontal thick line corresponds to the final size of the entire stellar system, i.e. considering all clusters together. Right: two projections of the final stellar distribution of the UFDs at z = 0. Particles are coloured according to their membership to clusters. The grey map in the background corresponds to the DM surface density. |
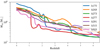 |
Fig. 5. Evolution of the virial mass of the dominant halo (i.e. the halo hosting the dominant cluster) as a function of redshift for each simulated UFD. |
4.2.1. Complex high-redshift environment
The large initial size of cluster h291 (however with a lower number of particles compared to others) is related to its complex environment. Between redshifts 7 and 5, the subhalo that hosts the majority of the stars in the hydrodynamics run is not fully in place and is permanently disturbed by the accretion of slightly smaller halos. Therefore, finding a compact and strongly gravitationally bound cluster in this halo is a difficult task. While its value at z = 6 is 35 pc, Fig. 4 shows strong variations with time, which is evidence of the hostility of the environment. At z = 4, the size of this dominant cluster reaches 75 pc, a value that is kept constant until the cluster merges with a second cluster at z = 0.7 leading to a final size of 79 pc.
4.2.2. Nearly isolated subhalos
h315 and h323 are two much simpler cases, each involving only two clusters. Starting from about 14 pc, the size of the mass-dominant cluster (cluster0) of h315 does not increase significantly until z = 3, when it suddenly suffers the gravitational influence of two dark halos (at respectively z ≅ 2 and z ≅ 1). This is sufficient to puff-up its size up to 25 pc at z = 1. The merger with the second cluster (cluster1) is the major factor responsible for its final size of R1/2,fin = 56.9 pc. The main halo of h323 does not suffer any strong perturbation until z = 1.3, where it suddenly interacts with a star-free dark halo that merges at z = 1. This merger induces an abrupt increase in the halo virial mass as seen in Fig. 5. We note that in this DMO run, the second cluster (cluster2) has still not merged at the end of the simulation, contrary to the hydrodynamics run. This is not surprising given the differences between the two runs in terms of resolution and baryonic physics, which leads to differences in the dark halo masses (see e.g. Garrison-Kimmel et al. 2017). It is clear that if this second cluster had merged, it would have contributed to a further increase in the size of the final UFD. With virial masses of 4.2 × 10⁸ and 3.8 × 10⁸ M⊙ (see Table 2) respectively, h315 and h323 are the lightest halos among our sample. This explains their simple buildup history, which results in relatively compact UFDs, albeit less compact than some observed UFD candidates.
4.2.3. Complex buildup histories
Increasing the halo mass leads to more complex histories with more clusters involved. In h277 and h249, three clusters participate in the formation of a UFD, and in h170 and h273, five clusters participate in each. In these four cases, the impact of cluster mergers is extremely clear, as seen from the evolution of the cluster size. In extreme cases, such as cluster0 in h249, R1/2 jumps from 20 up to 300 pc. Overall, these mergers lead to a strong expansion of the stellar system, with a final half-mass radius above 45 pc (see Table 2); the case of h170 is up to 100 pc1. This corresponds to an increase in the initial mass-dominant cluster size by a factor of between 2.5 and 5.
4.3. Properties at z = 0
The size and line-of-sight velocity dispersion of the stellar clusters at z = 0, and therefore those of the resulting UFDs, are given by the two last columns of Table 2. All halos but h323 end up with a half mass of greater than 30 pc, and none of them are able to reproduce the most compact UFD candidates reported in Fig. 1. The right panels of Figs. 3 and 4 display two different projections of the clusters at the end of the simulation. These clusters are colour coded according to their colour attributed in the previous plots. It is striking that, except for h323 again, where the dominant cluster does not merge with any of the others, all clusters exhibit complex morphological structures, which is the direct result of the assembly of those initially disconnected building blocks. In h277 and h291, the dominant clusters are strongly elongated. On the contrary, in h249 and h170, it is subdominant accreted clusters that form such an elongated structure. In h315 and h273, the destruction of accreted clusters leads to the formation of a stellar halo surrounding the main stellar system with an extension up to 2 kpc, which is about 20 times the half-mass radius.
As mentioned in Sect. 1, UFDs are characterised by a mean ellipticity of 0.4 (Martin et al. 2008) with some extreme cases showing values of greater than 0.6, as in Hercules and Boötes I (Roderick et al. 2015; Longeard et al. 2022). While it is often claimed that such features are evidence of gravitational tides generated by interaction with the Milky Way, our simulations show that such morphological features could also result from the late merger of clusters initially hosted in different subhalos: a natural prediction of a hierarchical cosmology. Moreover, extended stellar structures have been observed in Tucana II (Chiti et al. 2021) with member stars found up to 9 half-light radii. Such an extended halo is reproduced here by the merger of clusters ( h315 and h273), a scenario also supported by Tarumi et al. (2021).
We conclude that cluster mergers quickly lead to enlarged UFDs with extended and/or elongated stellar structures. Compact UFDs must result from a simple buildup history where the bulk of the stars form in one single mini-halo as observed for h323.
We finally compare the line-of-sight velocity dispersion of the stellar particles in the final UFDs with those derived from observations. The derived values range between 2.9 and 4.4 km s−1, in good agreement with those of UFDs (Simon 2019); except for Hercules, for which a velocity dispersion as high as 8 km s−1 was recently derived (Longeard et al. 2023). We observe a clear correlation between R1/2,fin and σLOS, fin, with the larger system being kinetically warmer. Once more here, h323 is an outlier as it is the only one with a velocity dispersion below 3 km s−1, which is certainly the result of the absence of a merger.
4.4. Influence of the number of particles per cluster
Up to this point, the number of particles forming clusters is set using f⋆ = f⋆,fid = 32, that is, we used 32 times more particles than the number of stars found per subhalo in the hydrodynamics run. Following our particle selection method, that is, defining a cluster as a group formed by the most gravitationally bound particles, the number of particles considered for each subhalo at z = 6 will determine the initial size of the cluster R1/2,init, which could further impact the final size of the UFDs at z = 0. Here, we explore the sensitivity of our previous results with respect to the value of f⋆. More precisely, we use the ratio f⋆,fid/f⋆, which we vary from 1 to 16. Here, a value of 16 means that 16 times fewer particles are used than in our fiducial setup. Table A.1 provides a complete view of the size of all clusters at z = 6, as well as the final size of the UFDs at z = 0 for different f⋆,fid/f⋆ ratios. We note that using a larger reduction factor is inadequate given our current resolution. The initial size of clusters would be smaller than the gravitational softening length.
For each of our seven halos, Fig. 6 shows both the initial size of the mass-dominant cluster (R1/2,init) and the size of the final UFD (R1/2,fin) with respect to f⋆,fid/f⋆. As expected, reducing the number of particles in clusters leads to both decreasing R1/2,init and R1/2,fin. If we ignore halo h291 for a while, applying a reduction factor of 4 reduces the initial size of all main clusters down to about 10 pc. With this setting, we still guarantee that the main halos contain a substantial number of particles, that is, more than 100 (only h315 is left with 80 particles in cluster0). Regarding the more compact systems (h323, h273, h249, h315), the curves corresponding to the size of the final UFDs flatten starting from 4 (bottom panel of Fig. 6), indicating a convergence. On average, we notice that decreasing the number of particles by a factor 16 leads to a reduction of the initial size by a factor of 3.3. However, this induces only a reduction of the final UFD size by 1.3 (30%). Importantly, at z = 0, all clusters display a final size of greater than 20 pc, independently of the choice of f⋆.
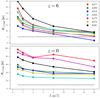 |
Fig. 6. Dependency of the initial size of the main cluster R1/2,init at z = 6 (top panel) and the final size of UFDs R1/2 (bottom panel) on the f⋆ parameter normalised here by the fiducial value f⋆,fid. Moving from 1 to 16, the number of particles in clusters is reduced accordingly. In both panels, the dotted horizontal line indicates the simulation resolution, that is, the gravitational softening length. |
Figure 7 shows the relation between the size of each cluster at z = 6 and the final size of the UFDs at z = 0. Clusters forming the same UFD are connected by a thin line and their size scales with the number of particles they contain. Each UFD is represented by a different colour and for each of them, a different f⋆ is shown through the f⋆,fid/f⋆ ratio 1, 2, 4, 8, or 16. Models with a specific ratio may be recognisable (counting from the top to the bottom), as a larger f⋆,fid/f⋆ leads to a smaller R1/2. First and foremost, Fig. 7 tells us that while starting with clusters as compact as 10 pc, the resulting UFD will have a half mass of greater than 30 pc, and up to 70 pc for model h277. UFDs that are built from more than one cluster, that is, all but h323, have a final R1/2 that is more compact than 50 pc and require the size of the initial cluster to be less than 20 pc. However, if UFDs are only formed by one single cluster (h323), this constraint is slightly relaxed. An initial size of 20 pc is enough to get R1/2 = 32 pc. Only this model can be more compact than 30 pc, requiring its dominant cluster to start with at most a size of 16 pc. Finally, it is worth mentioning that any system that start larger will end up building a larger UFD.
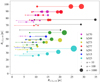 |
Fig. 7. Relation between the size of clusters at z = 6 and the final size of the UFDs formed at z = 0. Symbol size scales with the number of particles defining the cluster. Each UFD appears five times, for the five different f⋆,fid/f⋆ ratios considered, 1, 2, 4, 8, or 16. Smaller UFDs correspond to larger f⋆,fid/f⋆. The detailed values for each cluster and UFD are provided in Table A.1. |
4.5. Suppressing the formation of nearby clusters
As described in Sect. 3, our determination of the clusters relies on the stellar content of dark matter halos predicted by Sanati et al. (2023). One limitation to the physical model those simulations use is the lack of Lyman-Werner radiation from massive stars, which photo-dissociates the H2 molecule and strongly reduces the gas cooling. In a pristine interstellar medium, this process can suppress the formation of stars in the neighbourhood of the first formed building blocks (e.g. Wise & Cen 2009). While dedicated simulations with proper treatment of radiative transfer are needed to investigate whether or not this UV flux is strong enough to impact the formation site of the neighbouring physically decoupled clusters, our simulations can provide some estimations of the size of the resulting UFDs in an extreme case. Assuming that all clusters surrounding the main cluster have failed to form, the half-mass radius of a UFD will be that of its main cluster at z = 0. Table 3 gives the final size of each main cluster, together with an estimation of its mass. To maximise the effect, we choose f⋆,fid/f⋆ such that the clusters have an initial size of about 10 pc (see Table A.1). This extreme setting helps to form more compat UFDs, and with the exception of model h277, which remains very extended, three UFDs with a half mass as low as 25 pc can be formed.
Final size of the main clusters excluding the contribution of all other clusters.
5. Discussion and conclusions
Motivated to understand the difficulty cosmological hydrodynamics simulations have in reproducing the compactness of observed UFDs, we performed a set of seven very high-resolution DMO simulations of UFDs. Using a simple but powerful and numerically clean method that combines predictions of the stellar content of UFDs from hydrodynamics simulations with those new DMO runs, we followed the buildup history of UFDs; that is, how stellar building blocks (referred to here as clusters) formed before the end of the EoR assemble to form a UFD at z = 0. We focused in particular on the evolution of the size of those clusters as well as on the size of the resulting UFDs.
Our main findings are summarised below:
-
At z = 6 for all models, the stellar building blocks that assemble into a UFD at z = 0 are spatially disconnected; that is, they are hosted in separate mini-halos with relative distances that can extend to 130 ckpc (e.g. h291).
-
The fusion of these disconnected mini-halos has a strong impact on the final size of the resulting UFDs. From redshift 6 down to 0, we observe a general increase in the size of the stellar systems. This increase is the direct impact of cluster–cluster mergers including their respective host halo, or mergers between clusters and star-free halos.
-
As a consequence of these mergers, none of our experiments lead to the formation of a UFD with a half mass (half light) smaller than 20 pc, that is, regardless of f⋆, the parameter that sets the number of stars per mini-halo.
-
Ultra-faint dwarf galaxies, with a size smaller than 30 pc are obtained only if all stars are formed in one single mini-halo at z = 6, as in h323. The associated halo mass must be smaller than 4 × 10⁸ M⊙ and the size of the initial cluster smaller than 15 pc. More massive halos can form similarly compact UFDs, but only if the formation of neighbouring halos is prevented by, for example, Lyman-Werner radiation. In both cases, at z = 6, the stellar content must be strongly gravitationally bound.
-
Forming UFDs with a size of between 30 and 50 pc is possible despite more complex buildup histories, that is if the initial cluster size is smaller than 20 pc (h249, h273, h315) and all stellar particles are the most gravitationally bound ones.
-
If a larger cluster forms, for example with a size of 35 pc, the size of the UFD ends up relatively large (≅ 80 pc), even in the case of a simple buildup involving two clusters (h291).
-
A UFD that forms via a complex buildup involving several initially distinct clusters will be naturally extended, with r1/2 ⪆ 100 pc (h170, h277), despite the stellar building blocks being initially very compact and strongly gravitationally bound.
-
The fusion of initially spatially dissociated clusters systematically leads to peculiar signatures imprinted in the UFD stellar component, such as a pronounced ellipticity. Those structures could easily be confused with tidal tails (Martin et al. 2008; Adén et al. 2009; Roderick et al. 2015; Longeard et al. 2022). As in Tarumi et al. (2021), we also observed the formation of extended stellar halos in three of our models (h315, h170, h273). Such a feature is in line with the extended stellar population found around Tucana II (Chiti et al. 2021). It also supports the finding by Frebel et al. (2016) that multiple stellar populations observed in Boötes can originate from different stellar building blocks.
The above conclusions lead us to the following more general conclusions and comments. The difficulties in reproducing the most compact UFDs (R1/2 < 20 pc) must be taken with care. So far, no velocity dispersion measurements have been obtained to confirm the true nature of any of the four UFD candidates observed which such a small size. However, for two of them, Eridanus III and Draco II, determination of their metallicity distribution function was recently obtained with the HST CaHK narrow band (Fu et al. 2023). Both show a wide range of metallicities, supporting their UFD nature.
Forming very compact UFDs (R1/2 < 30 pc) requires that all member stars originate from the same mini-halo prior to the end of the EoR. In the absence of Lyman-Werner radiation, such a requirement imposes that UFDs form in relatively light dark halos with a virial mass of less than (3 × 10⁸ M⊙). This seems to be in agreement with the results of Jeon et al. (2021b), where the most compact UFDs were found – in hydrodynamical simulations5 – to be reproduced within halos lighter than 1.5 × 10⁸ M⊙. About 50 to 100 such halos are expected within 300 kpc around the Milky Way (Sawala et al. 2017), in agreement with predictions of the observed luminosity function of Milky Way satellites (Tollerud et al. 2008; Newton et al. 2018; Nadler et al. 2019).
Compact UFDs with R1/2 < 50 pc can be formed in a hierarchical cosmology but remain challenging as they require the size of the initial stellar building blocks to be more compact than 20 pc at z = 6. While this is achieved in the present DMO simulations, we recall that we define clusters as the most gravitationally bound particles in our systems, and therefore, by construction, neglected any physical process that could lead to their pre-heating and thus increase their size at the end of the EoR. In this sense, our method is extremely conservative. Any additional baryonic effect, such as stellar feedback, should undoubtedly lead to a more extended stellar system than the ones obtained here, possibly maintaining some tension with the data.
All simulations presented here were performed in a cosmological context, although without including tidal effects induced by the presence of a gravitationally dominating Milky Way. How would these effects impact the results? The smallest halos could be expected to be disrupted, thus reducing cluster–cluster mergers and preventing the size increase of the survivors. However, it is important to underline that the clusters followed in this work are deeply embedded in massive dark halos extended up to 20 kpc, which is roughly three orders of magnitude larger than the size of the stellar component. Those dark halos can act as a gravitational shield (Peñarrubia et al. 2008), preventing the disruption of their stellar counterpart. Dedicated simulations will be necessary to answer this point.
We also emphasise that the difficulty in reproducing the compactness of UFDs originates from the hierarchical formation of structures at the smallest scales, which is imposed by CDM. By suppressing the smallest dark halos, that is, not only their stellar content (potentially through H2 dissociation) but also the halos themselves, one can potentially reduce this tension. Such suppression is a direct expectation from warm dark matter (WDM) models, which are worthy of further study.
Finally, from a chemical evolution point of view, we underline the importance of the complex buildup of the more massive UFDs assembled from several initially physically decoupled stellar clusters. Putting together stellar populations that evolved separately for a certain amount of time can lead to the formation of a stellar system with inhomogeneous abundances; such inhomogeneities could therefore be used as a tracer of hierarchical assembly at the smallest scales.
However, see our remark in Sect. 2 regarding the resolution of those simulations.
Acknowledgments
We thank the referee for the very positive and constructive report, which helped to clarify and improve the manuscript. We thanks Nathan Monnet for helping in the identification of halo pairs. We are grateful to Myoungwon Jeon, Nicolas Longeard, Pascale Jablonka, Mahsa Sanati, Mladen Ivkovic for stimulating discussions. The data reduction and surface density maps have been performed using the parallelised Python PNBODY package (Revaz 2013) (https://lastro.epfl.ch/projects/pNbody/).
References
- Adén, D., Wilkinson, M. I., Read, J. I., et al. 2009, ApJ, 706, L150 [CrossRef] [Google Scholar]
- Agertz, O., Pontzen, A., Read, J. I., et al. 2020, MNRAS, 491, 1656 [Google Scholar]
- Applebaum, E., Brooks, A. M., Christensen, C. R., et al. 2021, ApJ, 906, 96 [NASA ADS] [CrossRef] [Google Scholar]
- Belokurov, V., Zucker, D. B., Evans, N. W., et al. 2007, ApJ, 654, 897 [Google Scholar]
- Belokurov, V., Walker, M. G., Evans, N. W., et al. 2009, MNRAS, 397, 1748 [CrossRef] [Google Scholar]
- Bovill, M. S., & Ricotti, M. 2009, ApJ, 693, 1859 [NASA ADS] [CrossRef] [Google Scholar]
- Brown, T. M., Tumlinson, J., Geha, M., et al. 2012, ApJ, 753, L21 [NASA ADS] [CrossRef] [Google Scholar]
- Bullock, J. S., & Boylan-Kolchin, M. 2017, ARA&A, 55, 343 [Google Scholar]
- Cerny, W., Pace, A. B., Drlica-Wagner, A., et al. 2021, ApJ, 920, L44 [NASA ADS] [CrossRef] [Google Scholar]
- Cerny, W., Martínez-Vázquez, C. E., Drlica-Wagner, A., et al. 2023, ApJ, 953, 1 [NASA ADS] [CrossRef] [Google Scholar]
- Chiti, A., Frebel, A., Simon, J. D., et al. 2021, Nat. Astron., 5, 392 [NASA ADS] [CrossRef] [Google Scholar]
- Collins, M. L. M., Charles, E. J. E., Martínez-Delgado, D., et al. 2022, MNRAS, 515, L72 [NASA ADS] [CrossRef] [Google Scholar]
- Frebel, A., Norris, J. E., Gilmore, G., & Wyse, R. F. G. 2016, ApJ, 826, 110 [NASA ADS] [CrossRef] [Google Scholar]
- Fu, S. W., Weisz, D. R., Starkenburg, E., et al. 2023, ApJ, submitted [arXiv:2306.06260] [Google Scholar]
- Gandhi, P. J., Wetzel, A., Hopkins, P. F., et al. 2022, MNRAS, 516, 1941 [NASA ADS] [CrossRef] [Google Scholar]
- Garrison-Kimmel, S., Wetzel, A., Bullock, J. S., et al. 2017, MNRAS, 471, 1709 [NASA ADS] [CrossRef] [Google Scholar]
- Gutcke, T. A., Pfrommer, C., Bryan, G. L., et al. 2022, ApJ, 941, 120 [NASA ADS] [CrossRef] [Google Scholar]
- Jeon, M., Besla, G., & Bromm, V. 2017, ApJ, 848, 85 [NASA ADS] [CrossRef] [Google Scholar]
- Jeon, M., Besla, G., & Bromm, V. 2021a, MNRAS, 506, 1850 [NASA ADS] [CrossRef] [Google Scholar]
- Jeon, M., Bromm, V., Besla, G., Yoon, J., & Choi, Y. 2021b, MNRAS, 502, 1 [NASA ADS] [CrossRef] [Google Scholar]
- Kirby, E. N., Simon, J. D., Geha, M., Guhathakurta, P., & Frebel, A. 2008, ApJ, 685, L43 [NASA ADS] [CrossRef] [Google Scholar]
- Kirby, E. N., Cohen, J. G., Simon, J. D., & Guhathakurta, P. 2015, ApJ, 814, L7 [CrossRef] [Google Scholar]
- Kleyna, J. T., Wilkinson, M. I., Evans, N. W., & Gilmore, G. 2005, ApJ, 630, L141 [NASA ADS] [CrossRef] [Google Scholar]
- Kormendy, J. 1985, ApJ, 295, 73 [NASA ADS] [CrossRef] [Google Scholar]
- Laevens, B. P. M., Martin, N. F., Ibata, R. A., et al. 2015, ApJ, 802, L18 [NASA ADS] [CrossRef] [Google Scholar]
- Longeard, N., Jablonka, P., Arentsen, A., et al. 2022, MNRAS, 516, 2348 [NASA ADS] [CrossRef] [Google Scholar]
- Longeard, N., Jablonka, P., Battaglia, G., et al. 2023, MNRAS, 525, 3086 [NASA ADS] [CrossRef] [Google Scholar]
- Ludlow, A. D., Schaye, J., Schaller, M., & Richings, J. 2019, MNRAS, 488, L123 [NASA ADS] [CrossRef] [Google Scholar]
- Ludlow, A. D., Fall, S. M., Schaye, J., & Obreschkow, D. 2021, MNRAS, 508, 5114 [NASA ADS] [CrossRef] [Google Scholar]
- Ludlow, A. D., Fall, S. M., Wilkinson, M. J., Schaye, J., & Obreschkow, D. 2023, MNRAS, submitted [arXiv:2306.05753] [Google Scholar]
- Martin, N. F., Ibata, R. A., Chapman, S. C., Irwin, M., & Lewis, G. F. 2007, MNRAS, 380, 281 [CrossRef] [Google Scholar]
- Martin, N. F., de Jong, J. T. A., & Rix, H.-W. 2008, ApJ, 684, 1075 [NASA ADS] [CrossRef] [Google Scholar]
- Martin, N. F., Ibata, R. A., Collins, M. L. M., et al. 2016, ApJ, 818, 40 [CrossRef] [Google Scholar]
- McConnachie, A. W. 2012, AJ, 144, 4 [Google Scholar]
- McQuinn, K. B. W., Mao, Y. Y., Cohen, R. E., et al. 2023, arXiv e-prints [arXiv:2307.08738] [Google Scholar]
- Muñoz, R. R., Carlin, J. L., Frinchaboy, P. M., et al. 2006, ApJ, 650, L51 [CrossRef] [Google Scholar]
- Nadler, E. O., Mao, Y.-Y., Green, G. M., & Wechsler, R. H. 2019, ApJ, 873, 34 [NASA ADS] [CrossRef] [Google Scholar]
- Newton, O., Cautun, M., Jenkins, A., Frenk, C. S., & Helly, J. C. 2018, MNRAS, 479, 2853 [CrossRef] [Google Scholar]
- Okamoto, S., Arimoto, N., Yamada, Y., & Onodera, M. 2012, ApJ, 744, 96 [NASA ADS] [CrossRef] [Google Scholar]
- Orkney, M. D. A., Read, J. I., Rey, M. P., et al. 2021, MNRAS, 504, 3509 [NASA ADS] [CrossRef] [Google Scholar]
- Peñarrubia, J., Navarro, J. F., & McConnachie, A. W. 2008, ApJ, 673, 226 [Google Scholar]
- Prgomet, M., Rey, M. P., Andersson, E. P., et al. 2022, MNRAS, 513, 2326 [CrossRef] [Google Scholar]
- Revaz, Y. 2013, Astrophysics Source Code Library [record ascl:1302.004] [Google Scholar]
- Revaz, Y., & Jablonka, P. 2018, A&A, 616, A96 [NASA ADS] [CrossRef] [EDP Sciences] [Google Scholar]
- Ricotti, M., & Gnedin, N. Y. 2005, ApJ, 629, 259 [NASA ADS] [CrossRef] [Google Scholar]
- Roderick, T. A., Jerjen, H., Mackey, A. D., & Da Costa, G. S. 2015, ApJ, 804, 134 [NASA ADS] [CrossRef] [Google Scholar]
- Rodriguez Wimberly, M. K., Cooper, M. C., Fillingham, S. P., et al. 2019, MNRAS, 483, 4031 [NASA ADS] [CrossRef] [Google Scholar]
- Salvadori, S., & Ferrara, A. 2009, MNRAS, 395, L6 [NASA ADS] [Google Scholar]
- Sanati, M., Revaz, Y., Schober, J., Kunze, K. E., & Jablonka, P. 2020, A&A, 643, A54 [NASA ADS] [CrossRef] [EDP Sciences] [Google Scholar]
- Sanati, M., Jeanquartier, F., Revaz, Y., & Jablonka, P. 2023, A&A, 669, A94 [NASA ADS] [CrossRef] [EDP Sciences] [Google Scholar]
- Sand, D. J., Olszewski, E. W., Willman, B., et al. 2009, ApJ, 704, 898 [NASA ADS] [CrossRef] [Google Scholar]
- Sand, D. J., Mutlu-Pakdil, B., Jones, M. G., et al. 2022, ApJ, 935, L17 [CrossRef] [Google Scholar]
- Sawala, T., Pihajoki, P., Johansson, P. H., et al. 2017, MNRAS, 467, 4383 [CrossRef] [Google Scholar]
- Schaller, M., Gonnet, P., Chalk, A. B. G., & Draper, P. W. 2016, in Proceedings of the Platform for Advanced Scientific Computing Conference, 2 [Google Scholar]
- Schaller,, M., Gonnet, P., Draper, P. W., et al. 2018, Astrophysics Source Code Library [record ascl:1805.020] [Google Scholar]
- Schaller, M., Borrow, J., Draper, P. W., et al. 2023, MNRAS, submitted [arXiv:2305.13380] [Google Scholar]
- Simon, J. D. 2019, ARA&A, 57, 375 [NASA ADS] [CrossRef] [Google Scholar]
- Simon, J. D., & Geha, M. 2007, ApJ, 670, 313 [NASA ADS] [CrossRef] [Google Scholar]
- Smith, S. E. T., Jensen, J., Roediger, J., et al. 2023, AJ, 166, 76 [CrossRef] [Google Scholar]
- Tarumi, Y., Yoshida, N., & Frebel, A. 2021, ApJ, 914, L10 [NASA ADS] [CrossRef] [Google Scholar]
- Tollerud, E. J., Bullock, J. S., Strigari, L. E., & Willman, B. 2008, ApJ, 688, 277 [NASA ADS] [CrossRef] [Google Scholar]
- Wheeler, C., Hopkins, P. F., Pace, A. B., et al. 2019, MNRAS, 490, 4447 [CrossRef] [Google Scholar]
- Wise, J. H., & Cen, R. 2009, ApJ, 693, 984 [NASA ADS] [CrossRef] [Google Scholar]
- Wyithe, J. S. B., & Loeb, A. 2006, Nature, 441, 322 [NASA ADS] [CrossRef] [Google Scholar]
Appendix A: Detailed properties of extracted clusters and UFDs.
Details of the number of particles (N) and size (R1/2) of all clusters at z = 6 and the resulting UFDs at z = 0.
All Tables
Final size of the main clusters excluding the contribution of all other clusters.
Details of the number of particles (N) and size (R1/2) of all clusters at z = 6 and the resulting UFDs at z = 0.
All Figures
|
Fig. 1. Comparison of the luminosity–size relation for dwarfs and UFDs as derived from both observations and simulations. The grey squares represent our UFD sample (see text for details). Coloured points stand for different simulations published with the references given at the bottom of the figure. The vertical red dotted line separates UFDs from brighter dwarfs. |
| In the text | |
|
Fig. 2. Relative positions of the selected clusters at z = 6 for each of the seven UFDs simulated. Clusters are indicated with a specific colour on top of the DM surface density in grey. Red ones correspond to the clusters containing the largest numbers of particles. The subpanels at the bottom show the projection in proper coordinates (100 pc × 100 pc) of each cluster. For each UFD, we show two different projections. |
| In the text | |
|
Fig. 3. Buildup history of UFDs and their final shape. Left: evolution of cluster size in proper units for the four models h277, h249, h315, and h323. Each line corresponds to one cluster and follows the colour code of Fig. 2, the red one being the main cluster, defined as the one with the largest number of particles. The dotted line at the bottom of the plot indicates the resolution of the simulation, i.e. the gravitational softening length. The horizontal thick line corresponds to the final size of the entire stellar system, i.e. considering all clusters together. Right: two projections of the final stellar distribution of the UFDs at z = 0. Particles are coloured according to their membership to clusters. The grey map in the background corresponds to the DM surface density. |
| In the text | |
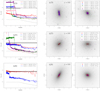 |
Fig. 4. As in Fig. 3 but for the three halos h170, h273, and h291. |
| In the text | |
|
Fig. 5. Evolution of the virial mass of the dominant halo (i.e. the halo hosting the dominant cluster) as a function of redshift for each simulated UFD. |
| In the text | |
|
Fig. 6. Dependency of the initial size of the main cluster R1/2,init at z = 6 (top panel) and the final size of UFDs R1/2 (bottom panel) on the f⋆ parameter normalised here by the fiducial value f⋆,fid. Moving from 1 to 16, the number of particles in clusters is reduced accordingly. In both panels, the dotted horizontal line indicates the simulation resolution, that is, the gravitational softening length. |
| In the text | |
|
Fig. 7. Relation between the size of clusters at z = 6 and the final size of the UFDs formed at z = 0. Symbol size scales with the number of particles defining the cluster. Each UFD appears five times, for the five different f⋆,fid/f⋆ ratios considered, 1, 2, 4, 8, or 16. Smaller UFDs correspond to larger f⋆,fid/f⋆. The detailed values for each cluster and UFD are provided in Table A.1. |
| In the text | |
Current usage metrics show cumulative count of Article Views (full-text article views including HTML views, PDF and ePub downloads, according to the available data) and Abstracts Views on Vision4Press platform.
Data correspond to usage on the plateform after 2015. The current usage metrics is available 48-96 hours after online publication and is updated daily on week days.
Initial download of the metrics may take a while.