Fig. 6.
Download original image
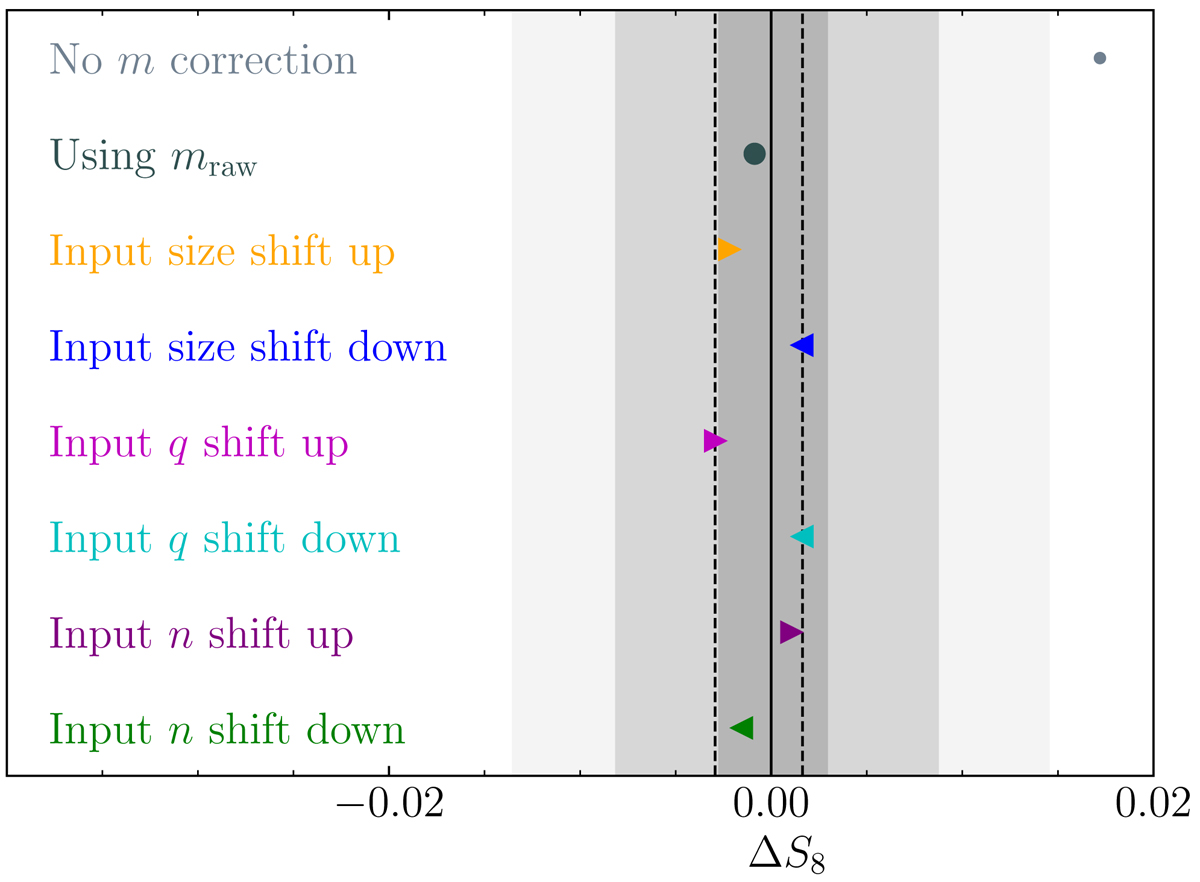
Shifts in best-fit values of S8 under different residual shear bias scenarios. The shift, ΔS8, is calculated as ![]() , where
, where ![]() represents the best-fit values in the test scenarios determined by a local minimisation method that uses the best-fit values from the fiducial analysis (
represents the best-fit values in the test scenarios determined by a local minimisation method that uses the best-fit values from the fiducial analysis (![]() ) as a starting point. The grey shaded regions represent different percentiles of the credible intervals derived from our fiducial POLYCHORD run. From the innermost to the outermost region, these percentiles are 6.8%, 20.4%, and 34%, corresponding to 0.1, 0.3, and 0.5 fractions of the reported sampling uncertainties. The dashed lines display the maximum shifts encountered in the six sets of morphology test simulations. These maximum shifts are used as the additional uncertainties in the reported best-fit values to account for the systematic uncertainties arising from shear calibration.
) as a starting point. The grey shaded regions represent different percentiles of the credible intervals derived from our fiducial POLYCHORD run. From the innermost to the outermost region, these percentiles are 6.8%, 20.4%, and 34%, corresponding to 0.1, 0.3, and 0.5 fractions of the reported sampling uncertainties. The dashed lines display the maximum shifts encountered in the six sets of morphology test simulations. These maximum shifts are used as the additional uncertainties in the reported best-fit values to account for the systematic uncertainties arising from shear calibration.
Current usage metrics show cumulative count of Article Views (full-text article views including HTML views, PDF and ePub downloads, according to the available data) and Abstracts Views on Vision4Press platform.
Data correspond to usage on the plateform after 2015. The current usage metrics is available 48-96 hours after online publication and is updated daily on week days.
Initial download of the metrics may take a while.