Fig. 4.
Download original image
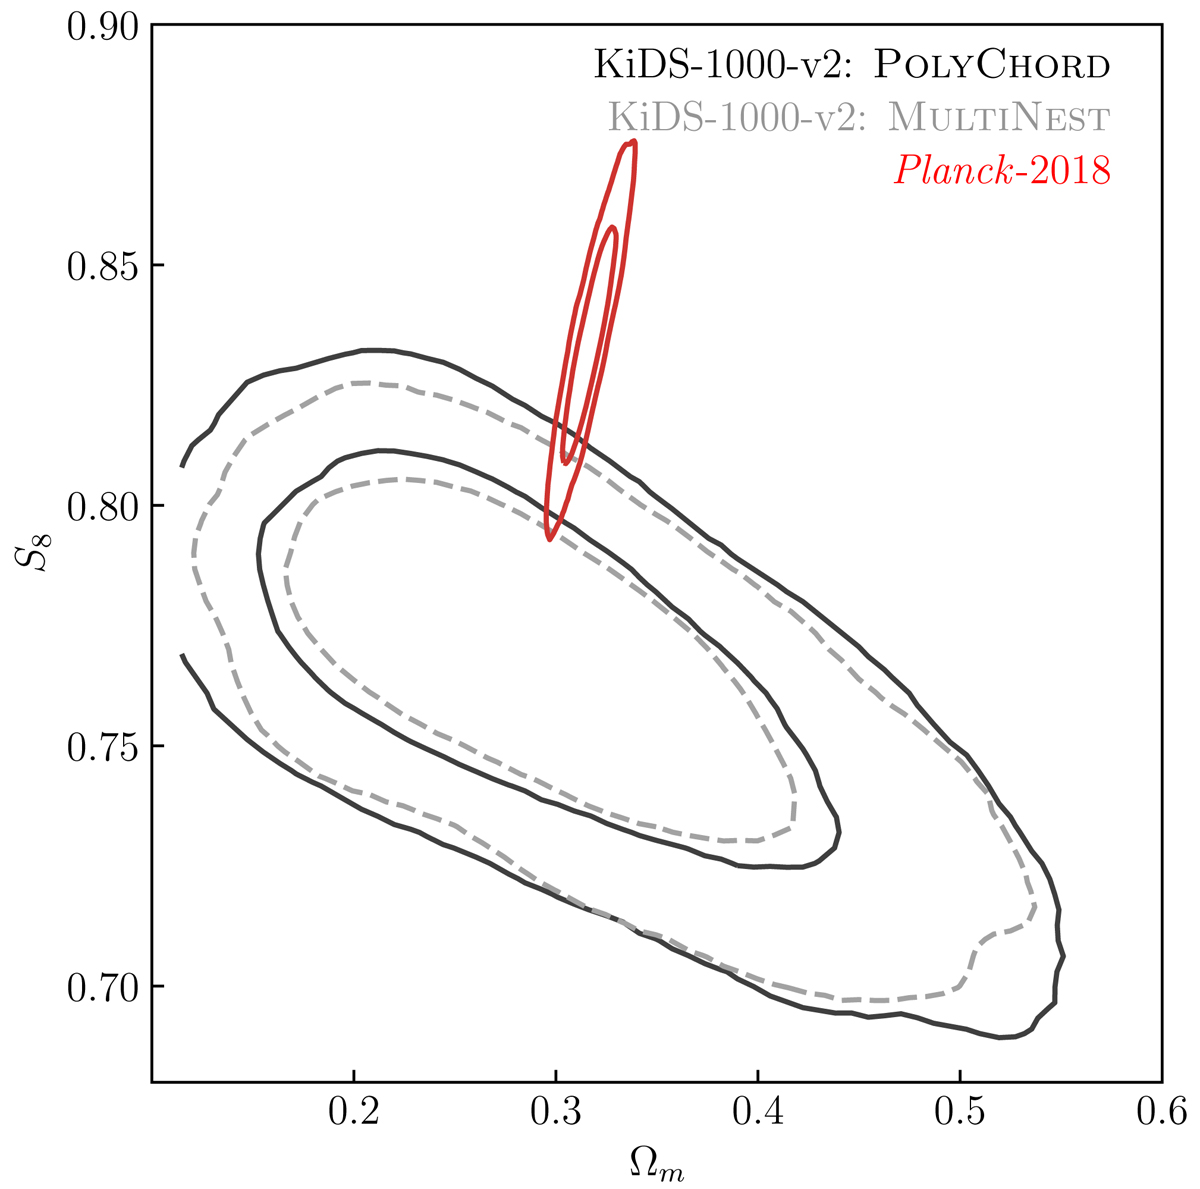
Comparison of projected 2D posterior distributions for the parameters Ωm and S8 as derived from our fiducial setups using two sampling codes – POLYCHORD (solid black line) and MULTINEST (dashed grey line) – against the Planck-2018 results (solid red line). The contours correspond to the 68% and 95% credible intervals and are smoothed using a Gaussian kernel density estimation (KDE) with a bandwidth scaled by a factor of 1.5, made possible by the ChainConsumer package (Hinton 2016).
Current usage metrics show cumulative count of Article Views (full-text article views including HTML views, PDF and ePub downloads, according to the available data) and Abstracts Views on Vision4Press platform.
Data correspond to usage on the plateform after 2015. The current usage metrics is available 48-96 hours after online publication and is updated daily on week days.
Initial download of the metrics may take a while.