Fig. 3.
Download original image
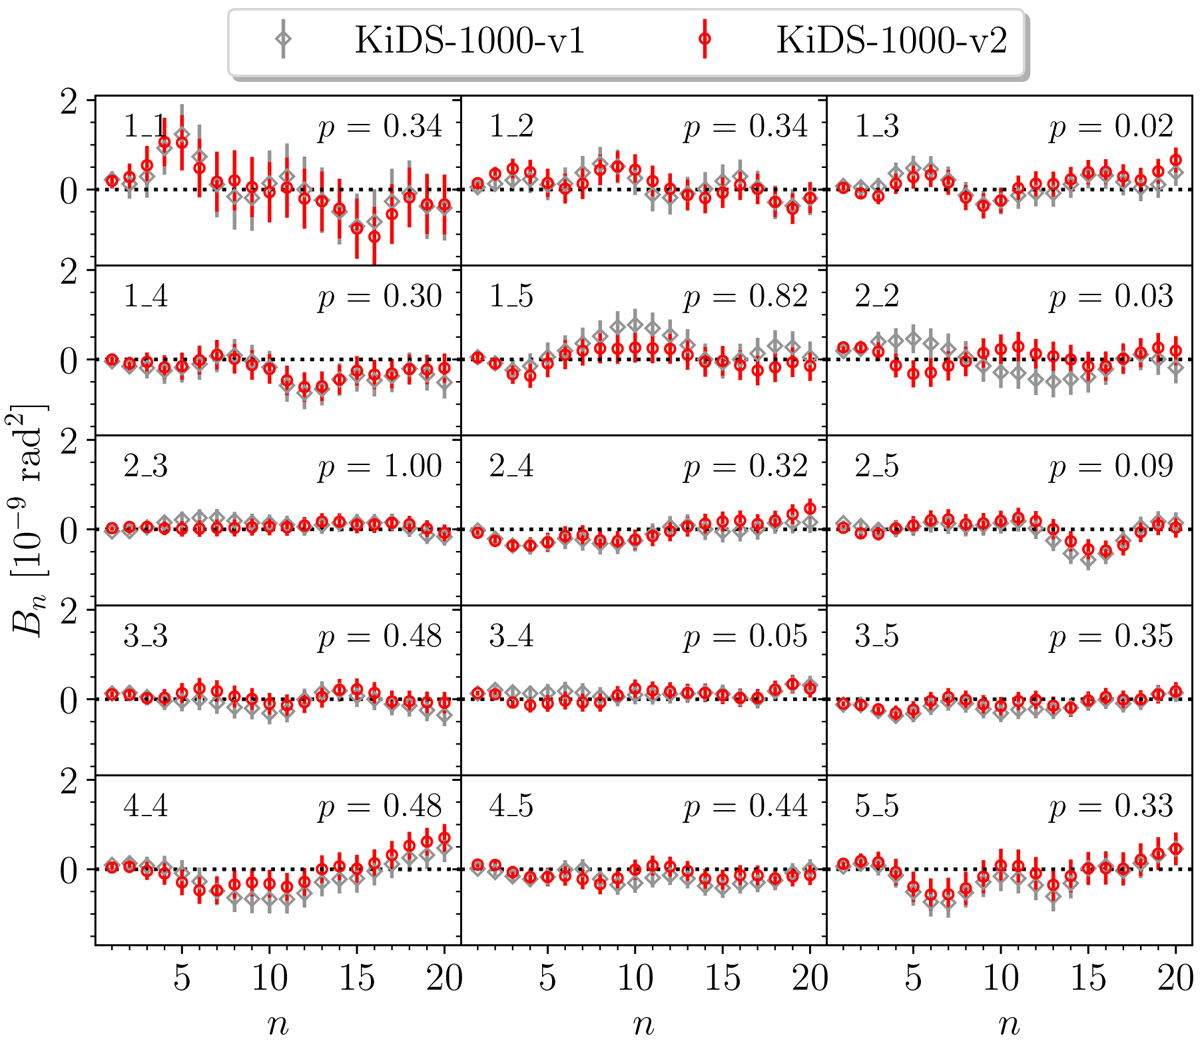
Measurements of the B-mode signals using COSEBIs for the KiDS-1000-v2 catalogue (red points) compared to the KiDS-1000-v1 catalogue (grey points). The error bars originate from the diagonal of an analytical covariance matrix, accounting solely for measurement noise. For the KiDS-1000-v2 catalogue, we re-calculated the covariance using the method introduced by Joachimi et al. (2021), incorporating the updated statistics. The p-values for the KiDS-1000-v2 catalogue, shown in the top-right corner of each panel, were calculated with 20 degrees of freedom, which corresponds to the number of modes used in each correlation.
Current usage metrics show cumulative count of Article Views (full-text article views including HTML views, PDF and ePub downloads, according to the available data) and Abstracts Views on Vision4Press platform.
Data correspond to usage on the plateform after 2015. The current usage metrics is available 48-96 hours after online publication and is updated daily on week days.
Initial download of the metrics may take a while.