Fig. 2.
Download original image
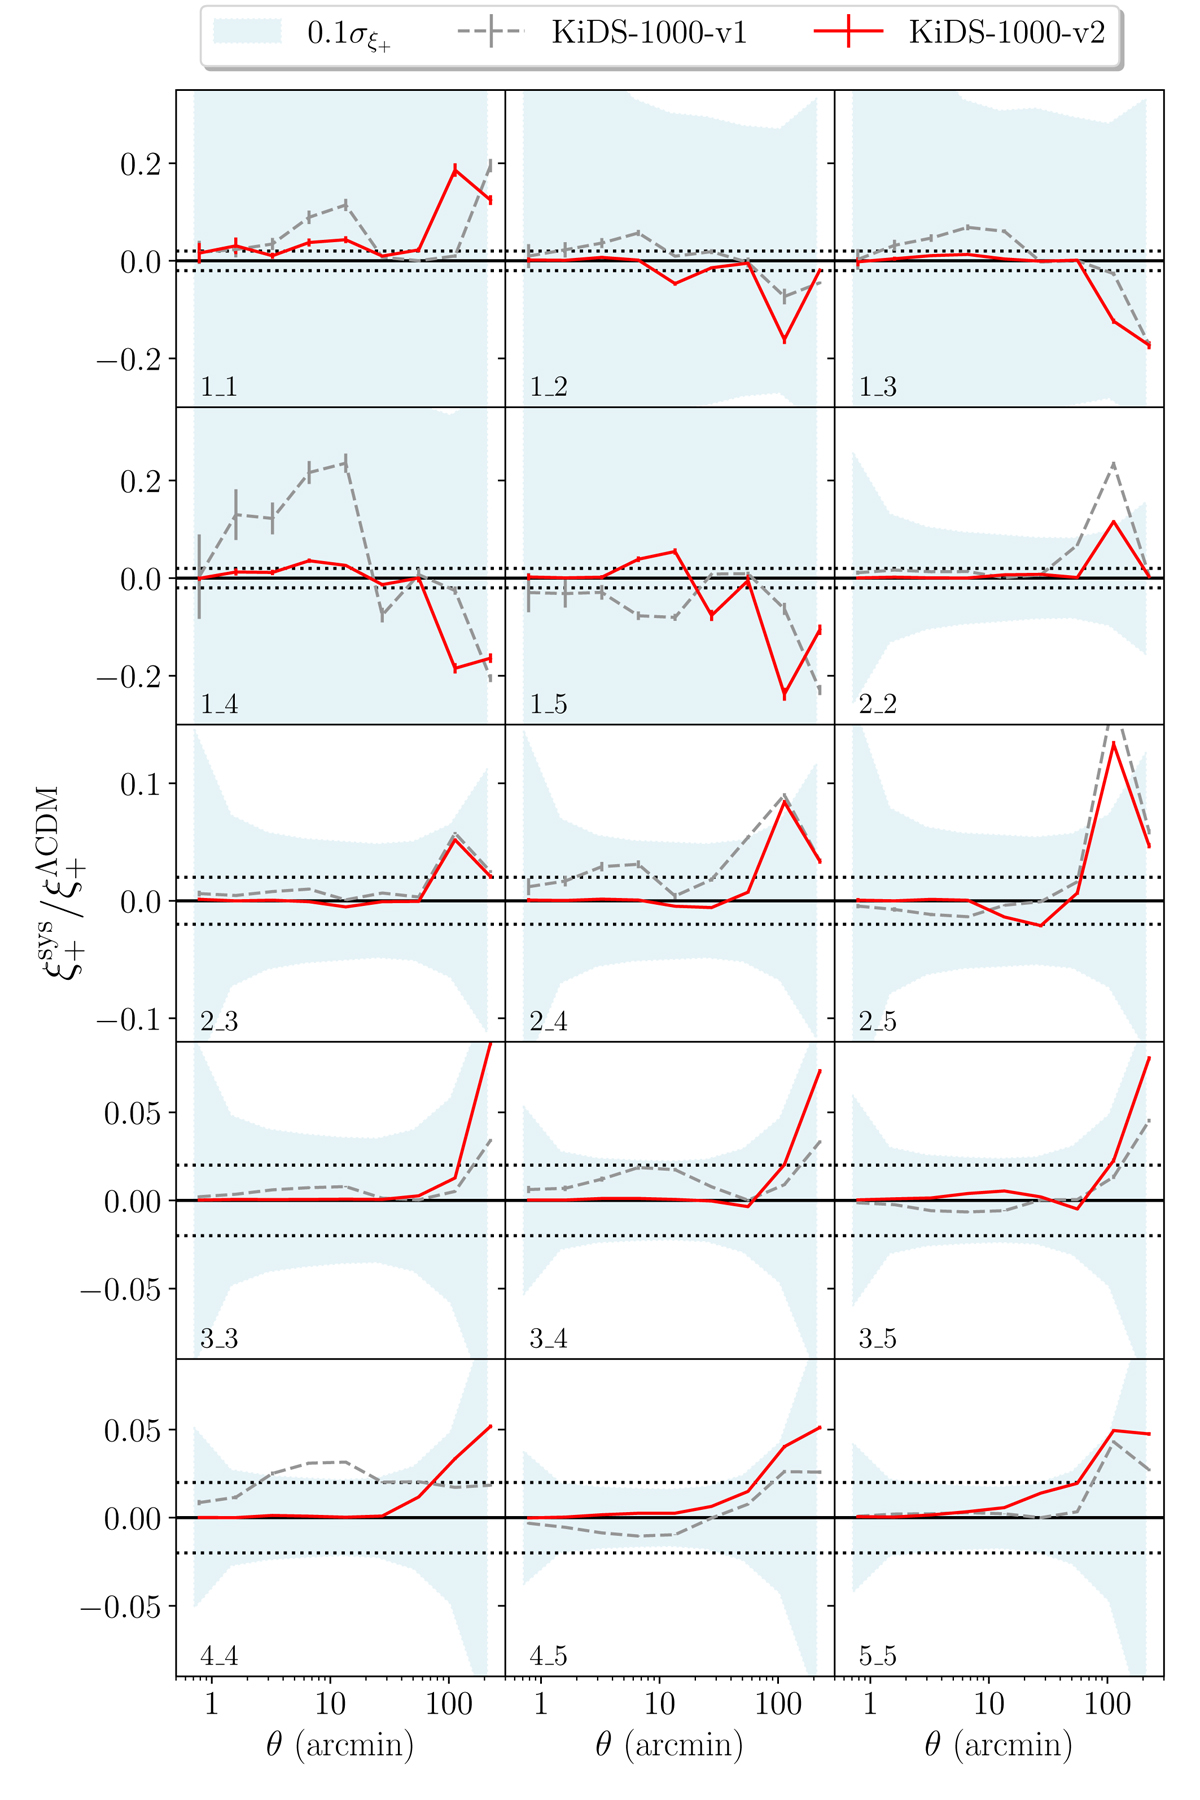
Ratio of the PSF contamination, ![]() , computed using Eq. (3) to the predicted amplitude of the cosmic shear signal,
, computed using Eq. (3) to the predicted amplitude of the cosmic shear signal, ![]() , across all 15 tomographic bin combinations. The red lines depict results from the KiDS-1000-v2 catalogue, whereas the grey lines show those from the KiDS-1000-v1 catalogue. The blue shaded regions represent a range of ±10% of the standard deviation of the measured cosmic shear signal. This deviation is determined from the covariance matrix using statistics from the KiDS-1000-v2 catalogue. The dotted horizontal lines indicate the 2% level of the predicted cosmic shear signal.
, across all 15 tomographic bin combinations. The red lines depict results from the KiDS-1000-v2 catalogue, whereas the grey lines show those from the KiDS-1000-v1 catalogue. The blue shaded regions represent a range of ±10% of the standard deviation of the measured cosmic shear signal. This deviation is determined from the covariance matrix using statistics from the KiDS-1000-v2 catalogue. The dotted horizontal lines indicate the 2% level of the predicted cosmic shear signal.
Current usage metrics show cumulative count of Article Views (full-text article views including HTML views, PDF and ePub downloads, according to the available data) and Abstracts Views on Vision4Press platform.
Data correspond to usage on the plateform after 2015. The current usage metrics is available 48-96 hours after online publication and is updated daily on week days.
Initial download of the metrics may take a while.