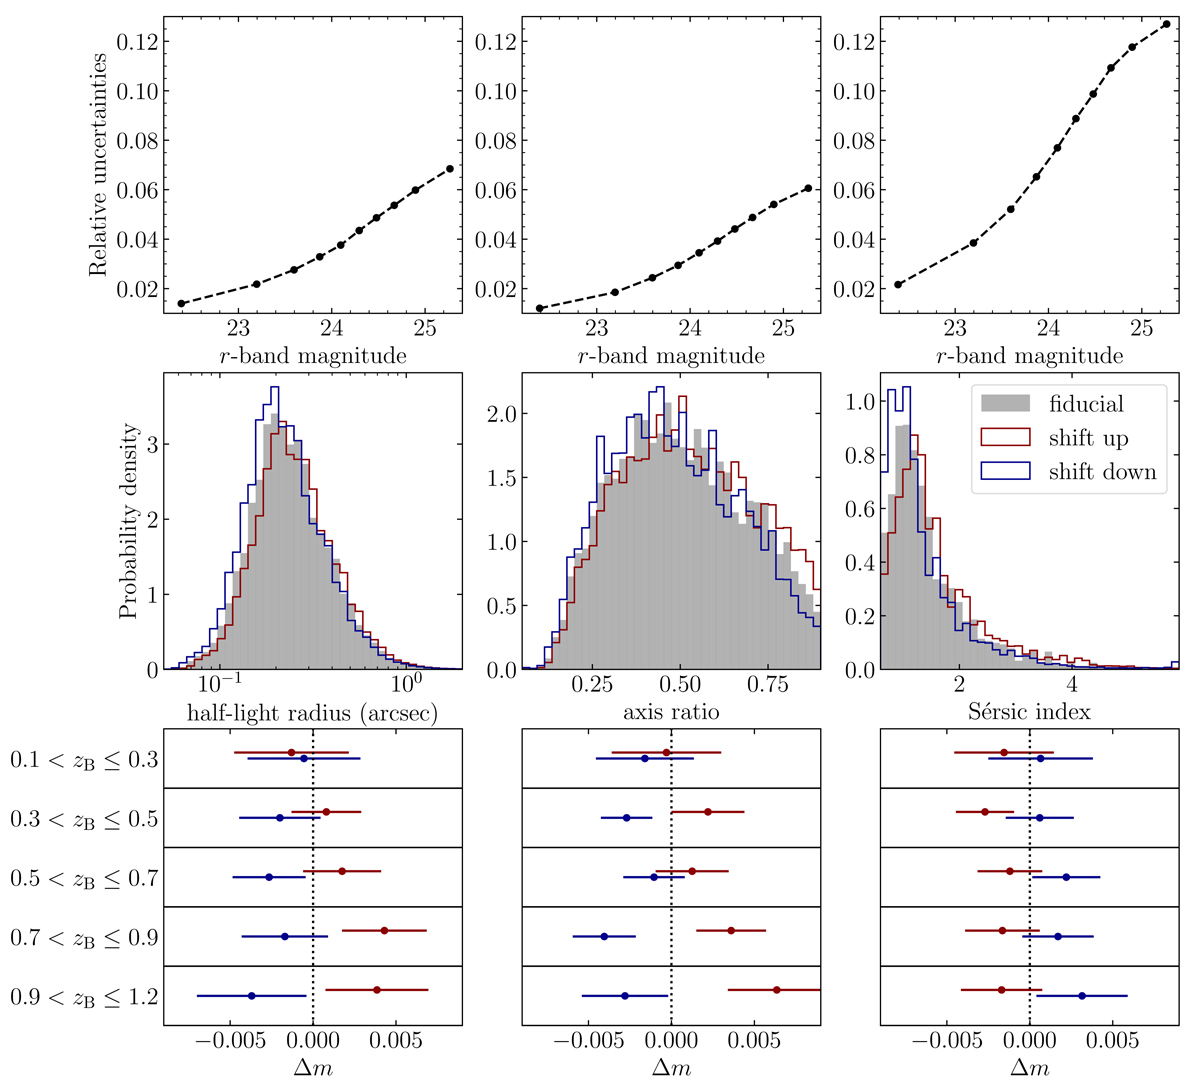
Fig. C.1.
Download original image
Changes in input morphological parameter values for assessing residual biases after simulation-based shear calibration. From left to right, the order is half-light radius, axis ratio, and Sérsic index. Top panels: Relationship between relative fitting uncertainties and the r-band magnitude, as measured from the catalogues of Griffith et al. (2012). The values shown are calculated using the median values of the binned samples. Middle panels: Overall distributions of input morphological parameters. Comparisons are drawn among the fiducial (grey shades), the test sample with input values increased by an amount corresponding to the relative uncertainties (red lines), and the test sample with input values decreased by the same amount of relative uncertainties (blue lines). Bottom panels: Shifts in multiplicative biases in tomographic bins resulting from changes in input morphological parameter values. Both fiducial and test simulations are re-weighted using the same dataset via the method detailed in Sect. 3.1.
Current usage metrics show cumulative count of Article Views (full-text article views including HTML views, PDF and ePub downloads, according to the available data) and Abstracts Views on Vision4Press platform.
Data correspond to usage on the plateform after 2015. The current usage metrics is available 48-96 hours after online publication and is updated daily on week days.
Initial download of the metrics may take a while.