Fig. 6
Download original image
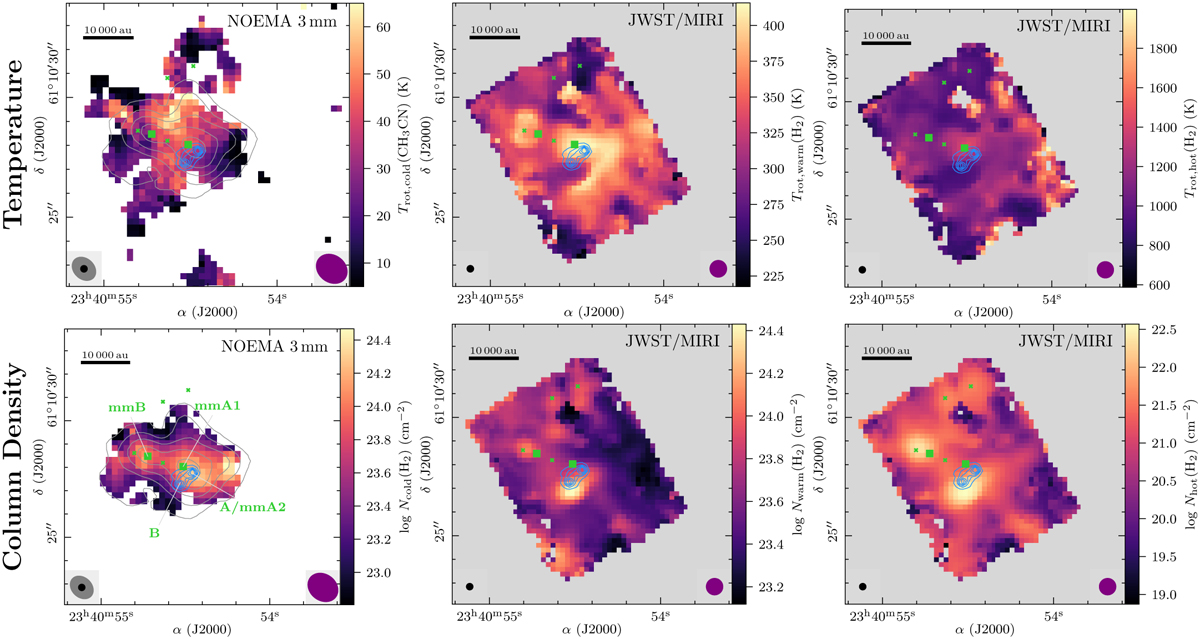
Temperature and H2 column density of the gas components in IRAS 23385 derived using CH3CN and H2 as a diagnostic tool (Sects. 3.3 and 3.4). In the top and bottom panels, the rotation temperature and H2 column density map, respectively, of the cold (left), warm (center), and hot (right) components are shown in color. The angular resolution of the line data is indicated by a purple ellipse in the bottom right corner. The JWST/MIRI 5.2 μm continuum is presented by blue contours with contour levels at 5, 10, 15, 20, and 25 × σcont,5μm and the angular resolution is highlighted by a black ellipse in the bottom left corner. The NOEMA 3 mm continuum (top and bottom left panels) is highlighted by gray contours with levels at 5, 10, 20, 40, and 80 × σcont,3mm and the synthesized beam is highlighted by a gray ellipse in the bottom left corner. All continuum sources are labeled in green in the bottom left panel and the mm continuum sources are marked by green squares. Several shock positions are indicated by green crosses (Sect. 3.2).
Current usage metrics show cumulative count of Article Views (full-text article views including HTML views, PDF and ePub downloads, according to the available data) and Abstracts Views on Vision4Press platform.
Data correspond to usage on the plateform after 2015. The current usage metrics is available 48-96 hours after online publication and is updated daily on week days.
Initial download of the metrics may take a while.