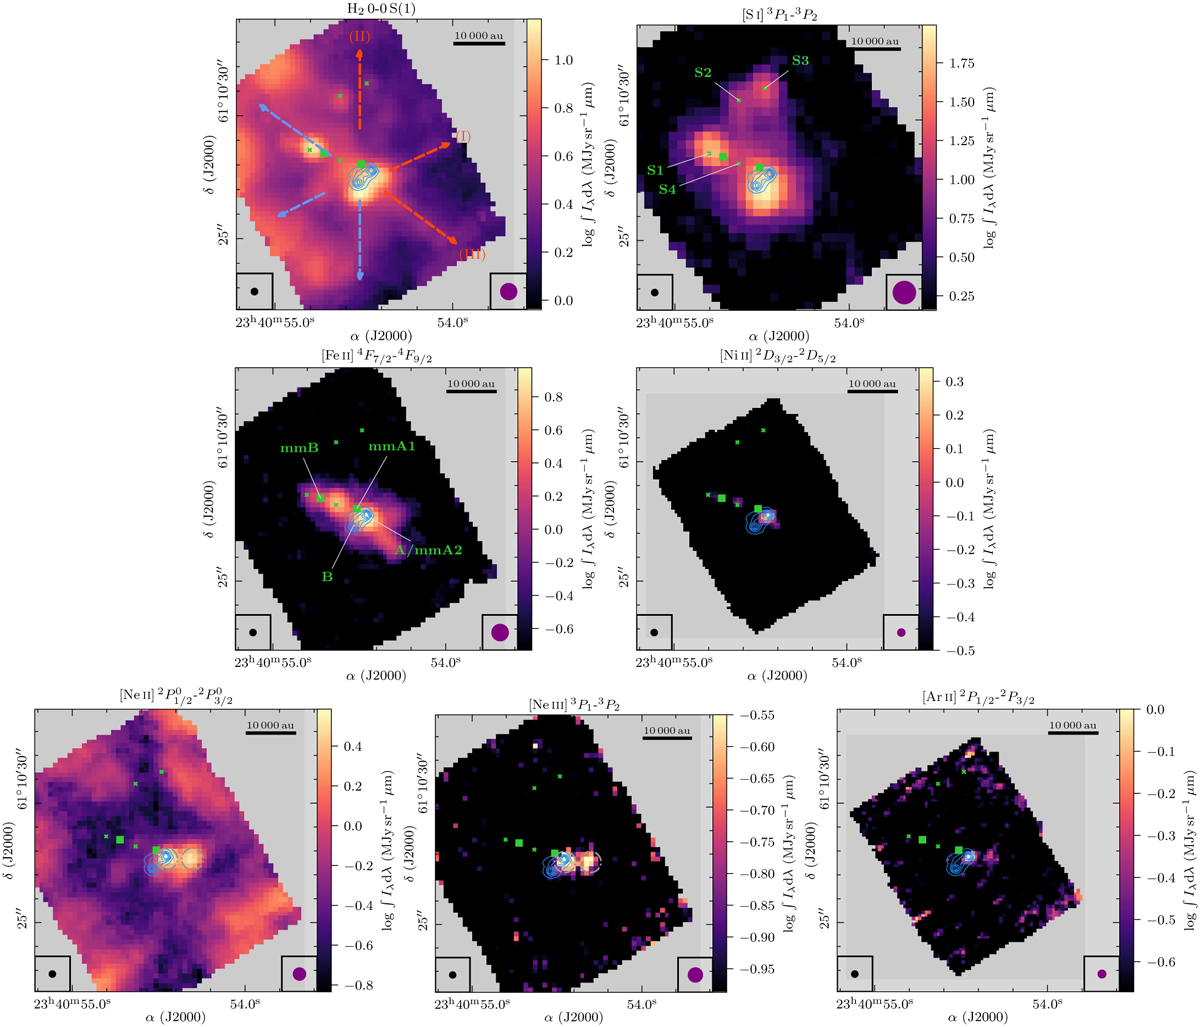
Fig. 3
Download original image
Integrated intensity maps of atomic and molecular lines detected with JWST/MIRI MRS. In color, the line-integrated intensity is shown in a log-scale. The JWST/MIRI 5.2 μm continuum is presented as blue contours with contour levels at 5, 10, 15, 20, and 25 × σcont,5μm. The two mm sources are indicated by green squares and several shock positions are highlighted by green crosses. The angular resolution of the JWST/MIRI continuum and the line data are shown in the bottom left and right corners, respectively. In the top left panel, the bipolar outflows are indicated by red and blue dashed arrows. The shock locations (Sect. 3.2) and continuum sources are labeled in the top right and center left panel, respectively. In the [Ne II] and [Ne III] panels, the dash-dotted gray circles show the aperture (0.″9) in which the flux density was derived (Sect. 4).
Current usage metrics show cumulative count of Article Views (full-text article views including HTML views, PDF and ePub downloads, according to the available data) and Abstracts Views on Vision4Press platform.
Data correspond to usage on the plateform after 2015. The current usage metrics is available 48-96 hours after online publication and is updated daily on week days.
Initial download of the metrics may take a while.