Fig. 2
Download original image
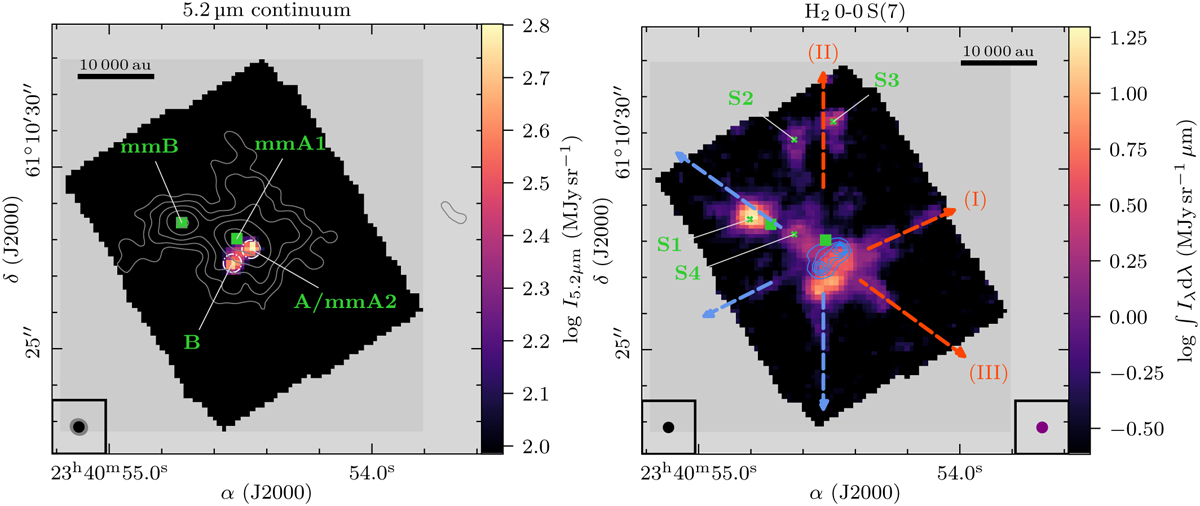
MIR Continuum (left) and H2 0−0 S(7) line emission (right) for IRAS 23385. In the left panel, the JWST/MIRI 5.2 μm continuum with emission >5σcont,5μm is presented in color. Gray contours show the NOEMA 1 mm continuum with contour levels at 5, 10, 20, 40, and 80×σcont,1mm. The dash-dotted white circles show the aperture in which the 5.2 μm flux density F5.2μm was derived (Table 3). In the bottom left corner, the JWST/MIRI 5.2 μm and NOEMA 1 mm angular resolutions are indicated in black and gray, respectively. The mm (mmA1 and mmB, marked by green squares) and MIR (A/mmA2 and B) continuum sources are labeled in green. In the right panel, the line-integrated intensity of the H2 0−0 S(7) line with S/N > 5 is presented in color. The JWST/MIRI 5.2 μm continuum as shown in the left panel is presented as blue contours with contour levels at 5, 10, 15, 20, and 25 × σcont,5μm. The angular resolutions of the 5.2 μm continuum and H2 0−0 S(7) line data are indicated in the bottom left and right, respectively. Several shock spots evident in the MIRI MRS line emission are marked by green crosses and labeled in green (Sect. 3.2). The red and blue arrows indicate three bipolar outflows, labeled I, II, and III (as presented in Beuther et al. 2023). In both panels, the black bar indicates a spatial scale of 10 000 au at the assumed source distance of 4.9 kpc.
Current usage metrics show cumulative count of Article Views (full-text article views including HTML views, PDF and ePub downloads, according to the available data) and Abstracts Views on Vision4Press platform.
Data correspond to usage on the plateform after 2015. The current usage metrics is available 48-96 hours after online publication and is updated daily on week days.
Initial download of the metrics may take a while.