Fig. 4
Download original image
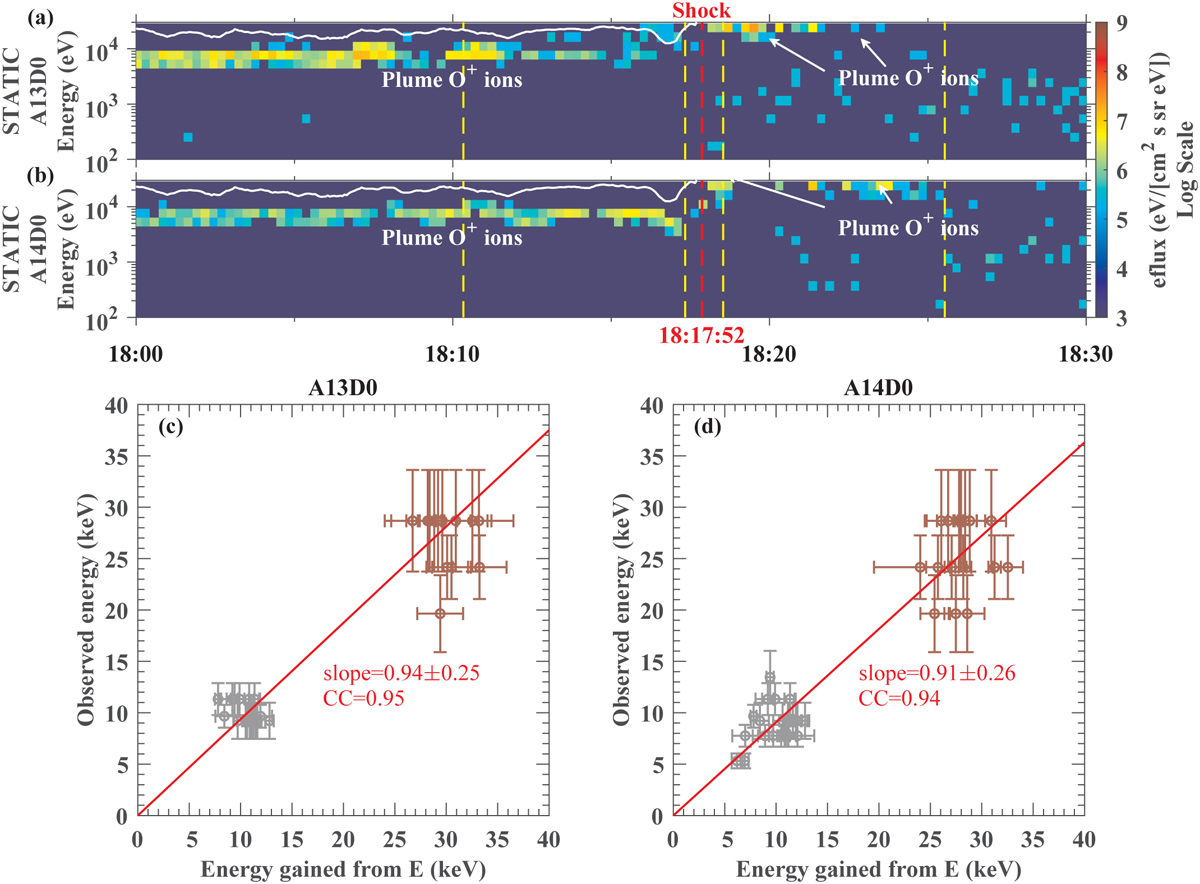
O+ energy-time spectrogram for the look directions of STATIC A13D0 (a) and A14D0 (b), shown at the top. The maximum energy curves for O+ pickup ions are overlaid on each spectrogram. The red vertical dashed line indicates the shock at ~18:17:52 UT. The intervals between two yellow dashed lines before and after the shock correspond to the shock upstream and downstream, respectively. Calculated energy gained from local convection electric field E vs. observed energy of O+ pickup ions in the look directions of STATIC A13D0 (c) and A14D0 (d) for the selected upstream (gray symbols) and downstream (brown symbols) intervals are shown at the bottom. The vertical error bars are measurement errors of ion energy. The horizontal error bars represent the standard deviation around the mean. The linear regression fitting slope and correlation coefficient are also shown.
Current usage metrics show cumulative count of Article Views (full-text article views including HTML views, PDF and ePub downloads, according to the available data) and Abstracts Views on Vision4Press platform.
Data correspond to usage on the plateform after 2015. The current usage metrics is available 48-96 hours after online publication and is updated daily on week days.
Initial download of the metrics may take a while.