Fig. 2
Download original image
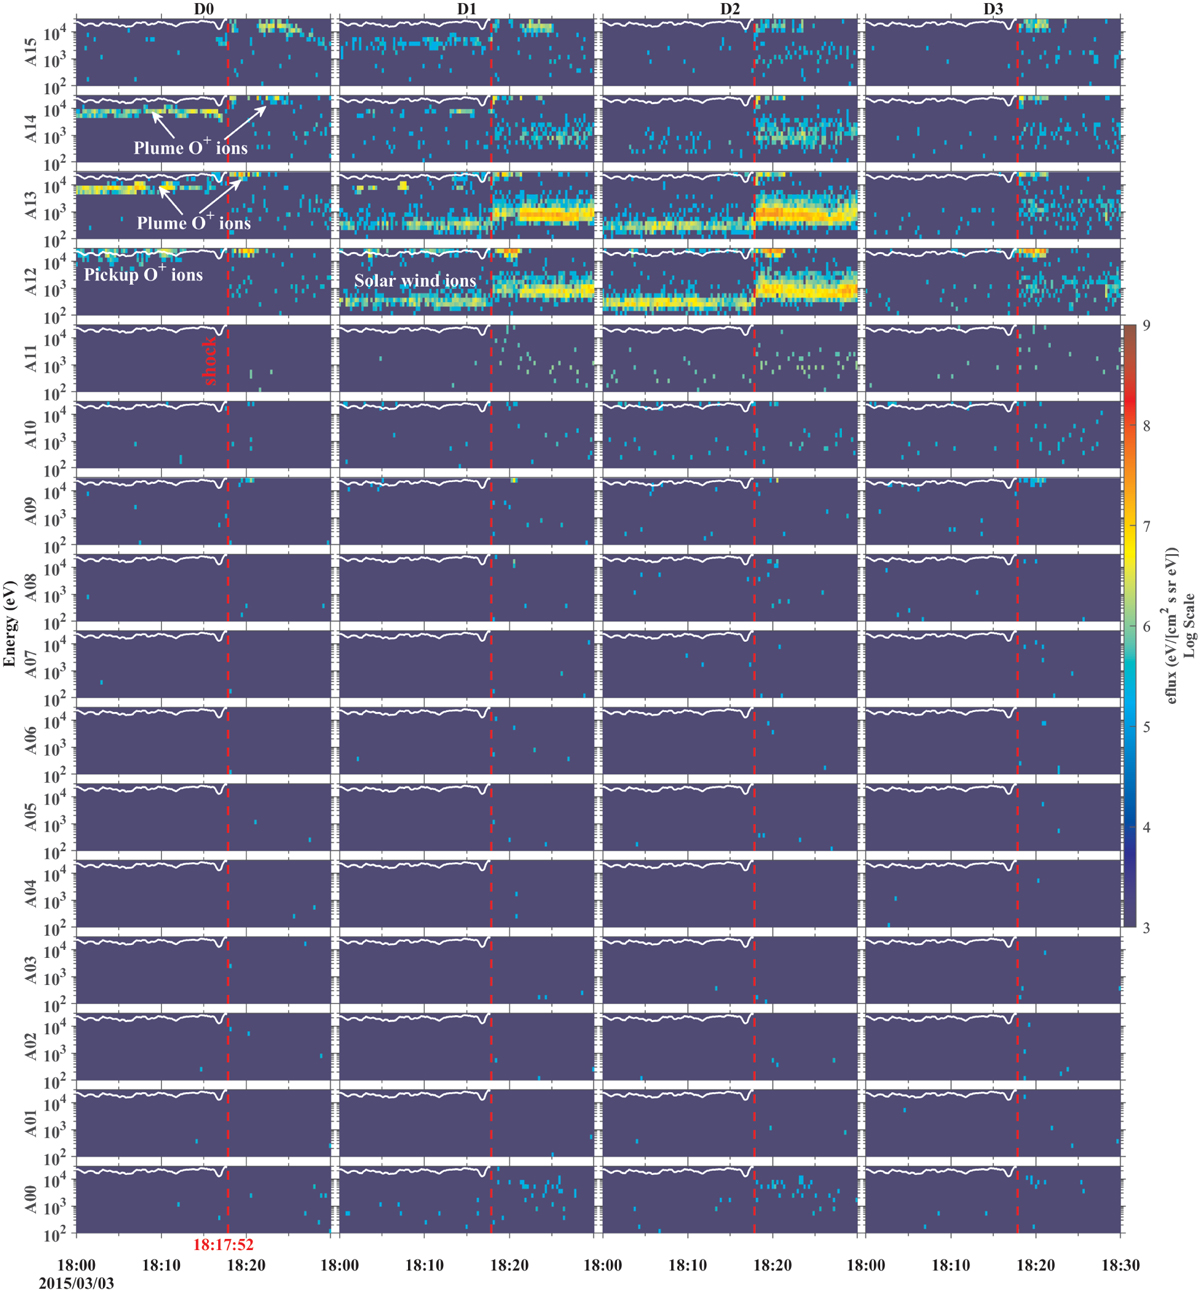
O+ energy-time spectrograms for all of the look directions of STATIC with its four deflection channels (D0-D3) and 16 anodes (A00-A15) during 18:00–18:30 UT on March 3, 2015. The vertical dashed lines indicate the shock at ~18:17:52 UT. The white curves overlaid on each spectrogram are the calculated maximum energy for O+ pickup ions.
Current usage metrics show cumulative count of Article Views (full-text article views including HTML views, PDF and ePub downloads, according to the available data) and Abstracts Views on Vision4Press platform.
Data correspond to usage on the plateform after 2015. The current usage metrics is available 48-96 hours after online publication and is updated daily on week days.
Initial download of the metrics may take a while.