Fig. 1

Download original image
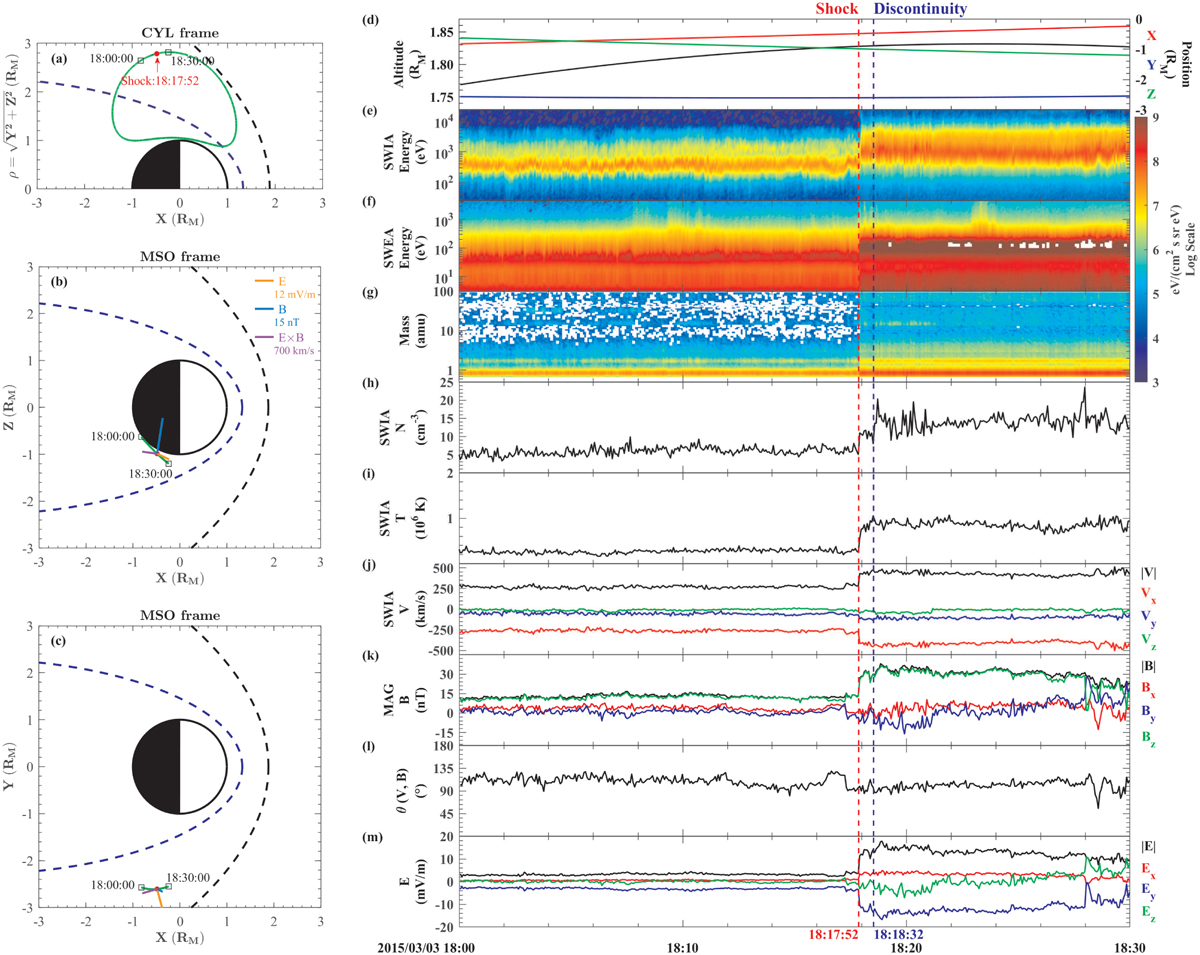
MAVEN orbit information (left panel): (a) MAVEN trajectory (green line) for the time period of orbit 822, on March 3, 2015, presented in a cylindrical (CYL) MSO coordinate frame. The blue curve and the black curve are the mean positions of the MPB and BS, respectively. The red point marks the position of MAVEN at the shock arrival time. (b−c) Projected MAVEN trajectory during 18:00–18:30 UT (a segment near the apoapsis of orbit 822) on the MSO XZ and XY planes, respectively. The local E, B, and E × B directions are shown by the orange, blue and purple lines on the MAVEN position at the shock arrival time, respectively. Overview plots of the shock encountered by MAVEN (right panel): (d) the spacecraft altitude and position, (e) ion energy spectra, (f) electron energy spectra, (g) ions mass spectra, (h) proton density, (i) proton temperature, (j) proton velocity components in MSO coordinates and proton bulk speed, (k) magnetic field components in MSO coordinates and magnetic field magnitude, (l) angle between V and B, and (m) convection electric field components in MSO coordinates and electric field magnitude. The red and blue vertical dashed lines indicate a fast shock and a discontinuity, respectively.
Current usage metrics show cumulative count of Article Views (full-text article views including HTML views, PDF and ePub downloads, according to the available data) and Abstracts Views on Vision4Press platform.
Data correspond to usage on the plateform after 2015. The current usage metrics is available 48-96 hours after online publication and is updated daily on week days.
Initial download of the metrics may take a while.


