Open Access
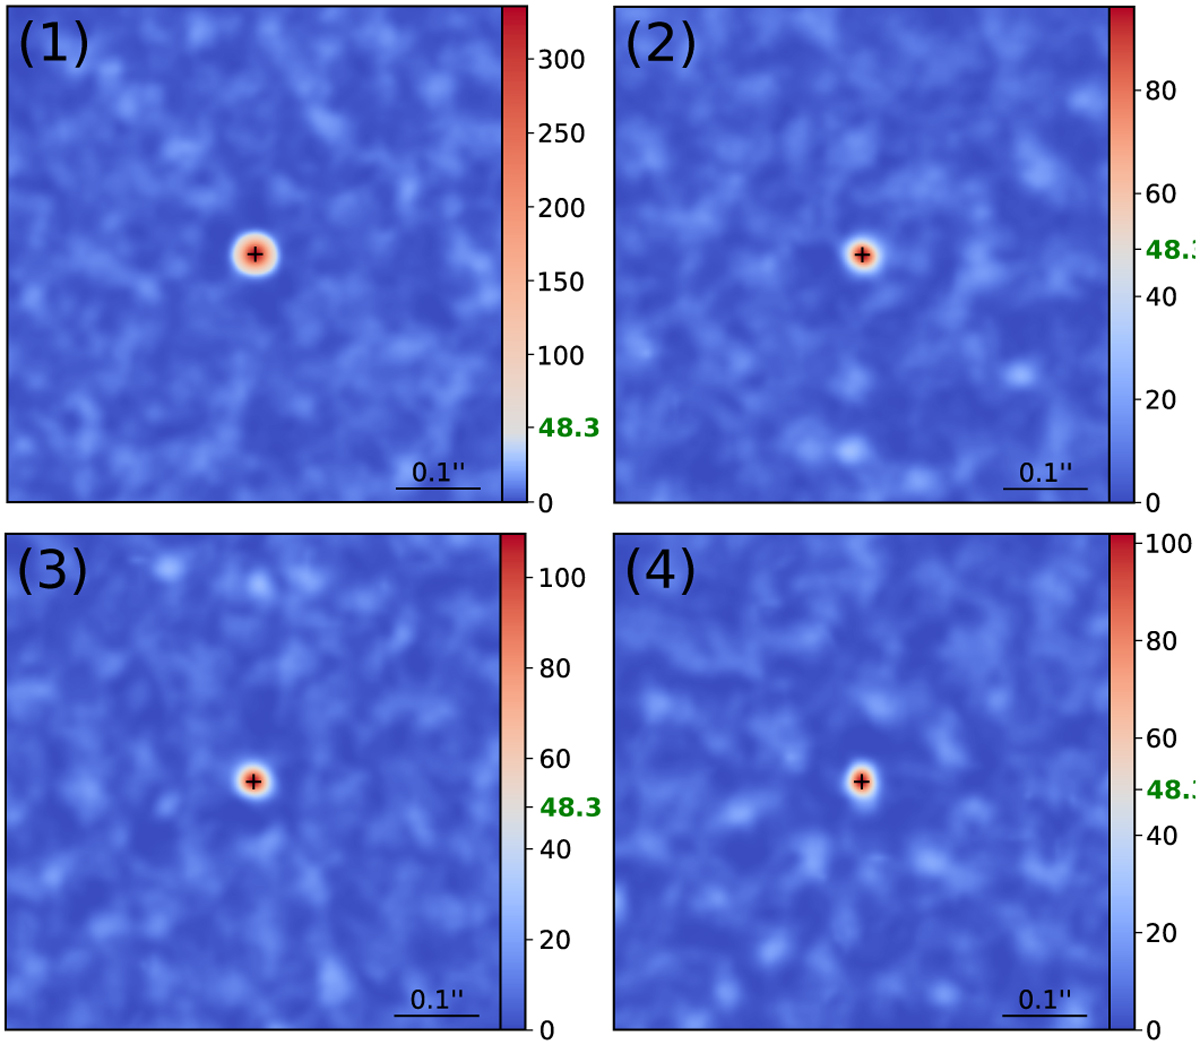
Fig. 8
Download original image
Cost function maps around the optimal solution estimated by PACOME for each injected source in a ROI of 50 pixels wide sampled with four nodes per pixel. The value of the empirical multi-epoch detection threshold ![]() (1 − 2.33 × 10⁻¹²) ≈ 48.3 is highlighted in green in the color bar.
(1 − 2.33 × 10⁻¹²) ≈ 48.3 is highlighted in green in the color bar.
Current usage metrics show cumulative count of Article Views (full-text article views including HTML views, PDF and ePub downloads, according to the available data) and Abstracts Views on Vision4Press platform.
Data correspond to usage on the plateform after 2015. The current usage metrics is available 48-96 hours after online publication and is updated daily on week days.
Initial download of the metrics may take a while.