Fig. E.1
Download original image
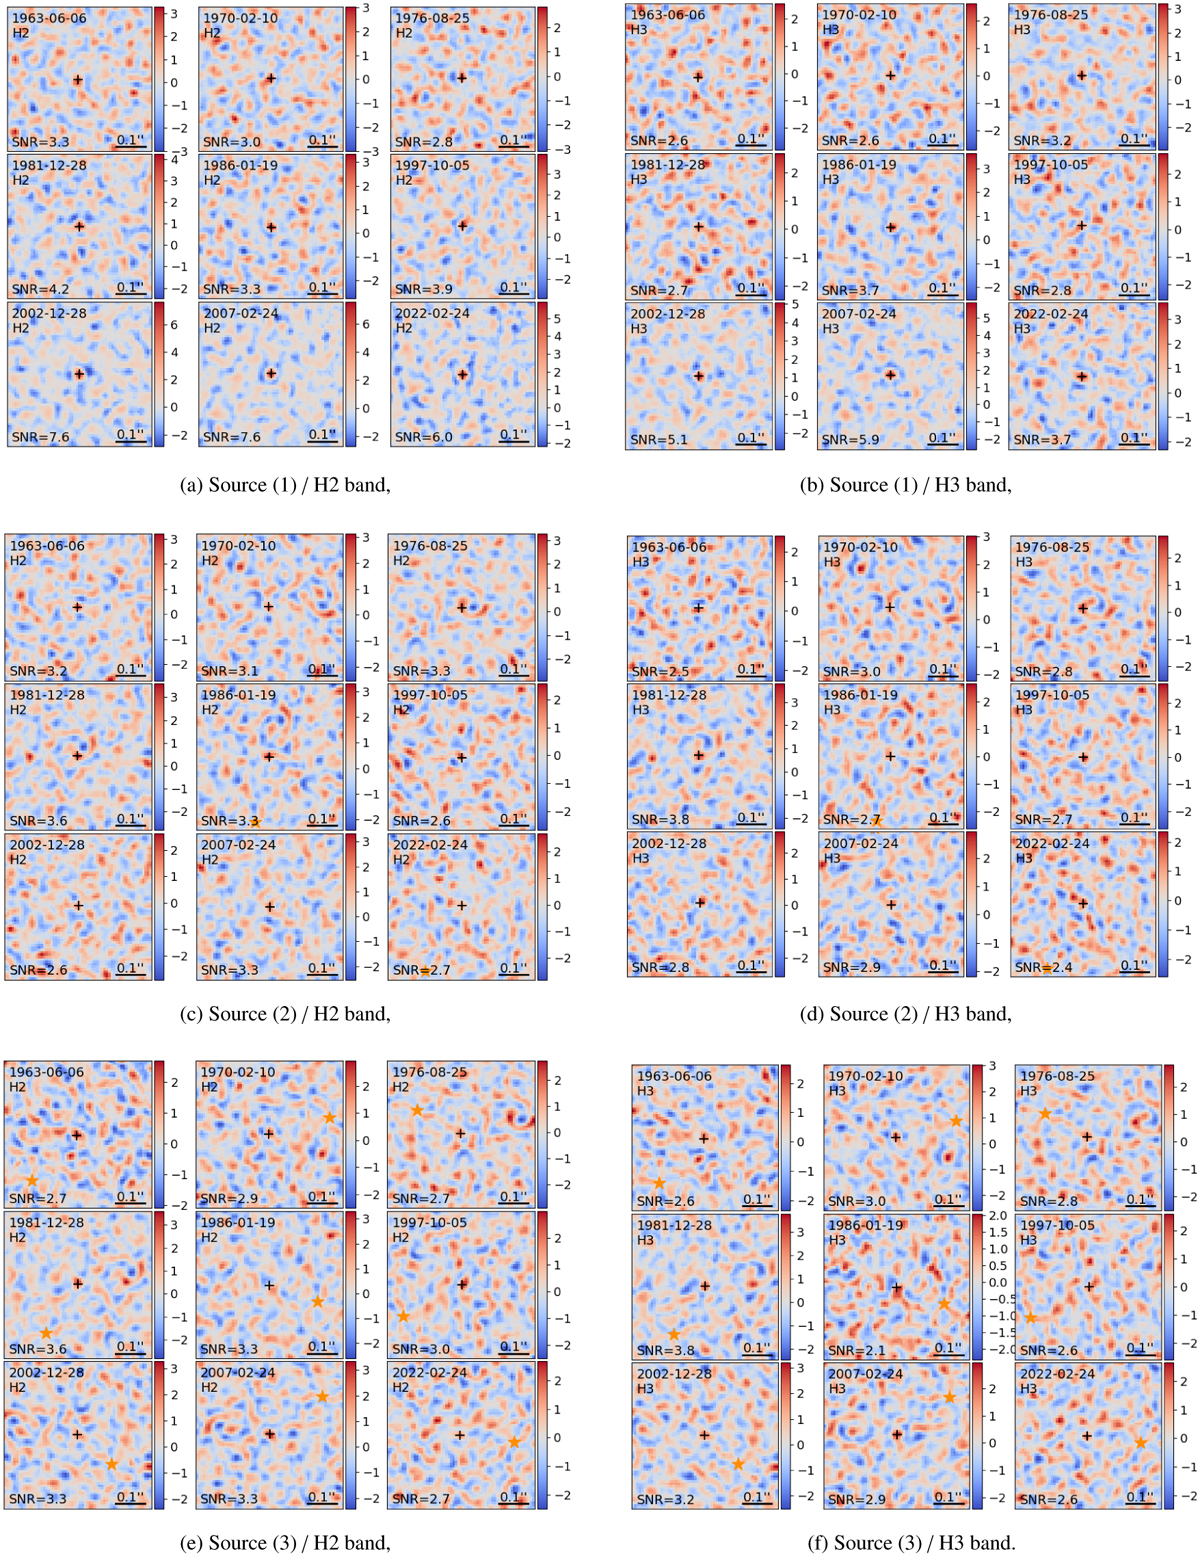
Individual (mono-epoch) 𝒮/𝒩t,ℓ maps produced by PACO around the optimal solutions found by PACOME for the four injected sources (1), (2), (3), and (4) considered in the semi-synthetic benchmark of Sect. 4.4. The black cross indicates the source location found by PACOME. The dynamic of the color bars is adapted to the minimum and maximum values of the displayed ROIs.
Current usage metrics show cumulative count of Article Views (full-text article views including HTML views, PDF and ePub downloads, according to the available data) and Abstracts Views on Vision4Press platform.
Data correspond to usage on the plateform after 2015. The current usage metrics is available 48-96 hours after online publication and is updated daily on week days.
Initial download of the metrics may take a while.