Fig. 9.
Download original image
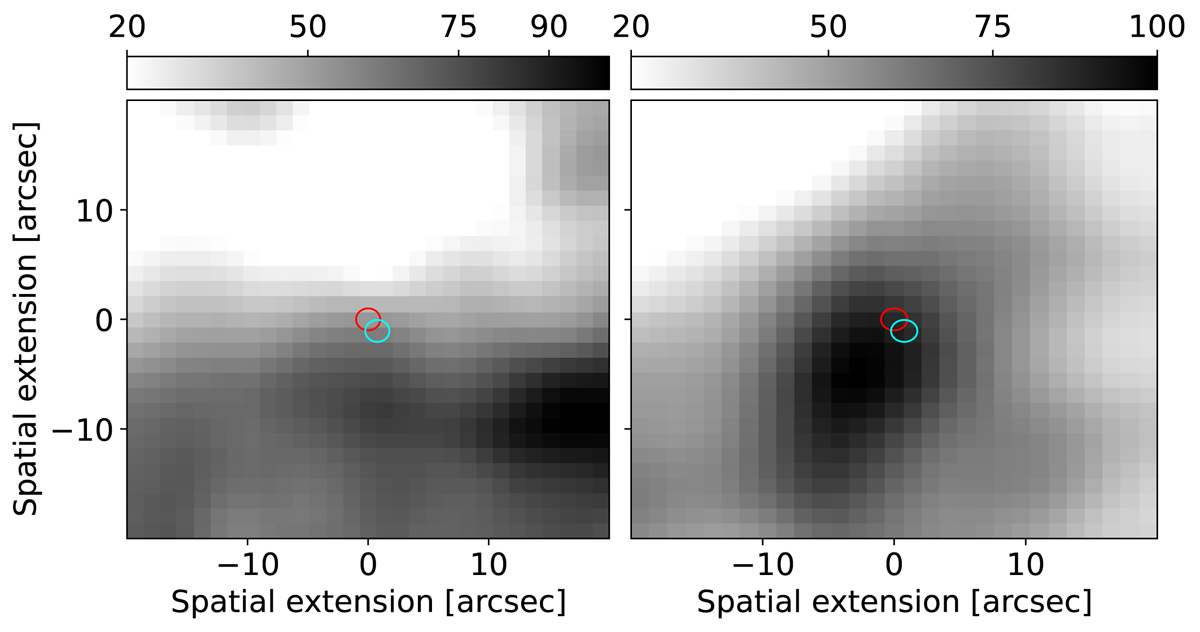
WISE data of the 40 × 40 arcsec field centred on V1425 Aql. The left and right plots show the band 3 and band 4 images, respectively. As in the other maps, the orientation is north up, east to the left. Both linear colour maps have an intensity range of 20% (white) to 100% (black) of the intensity range in the shown area. The circles mark the positions of the two ejecta. The size of the circles also roughly corresponds to the extension of the ejecta.
Current usage metrics show cumulative count of Article Views (full-text article views including HTML views, PDF and ePub downloads, according to the available data) and Abstracts Views on Vision4Press platform.
Data correspond to usage on the plateform after 2015. The current usage metrics is available 48-96 hours after online publication and is updated daily on week days.
Initial download of the metrics may take a while.