Fig. 7.
Download original image
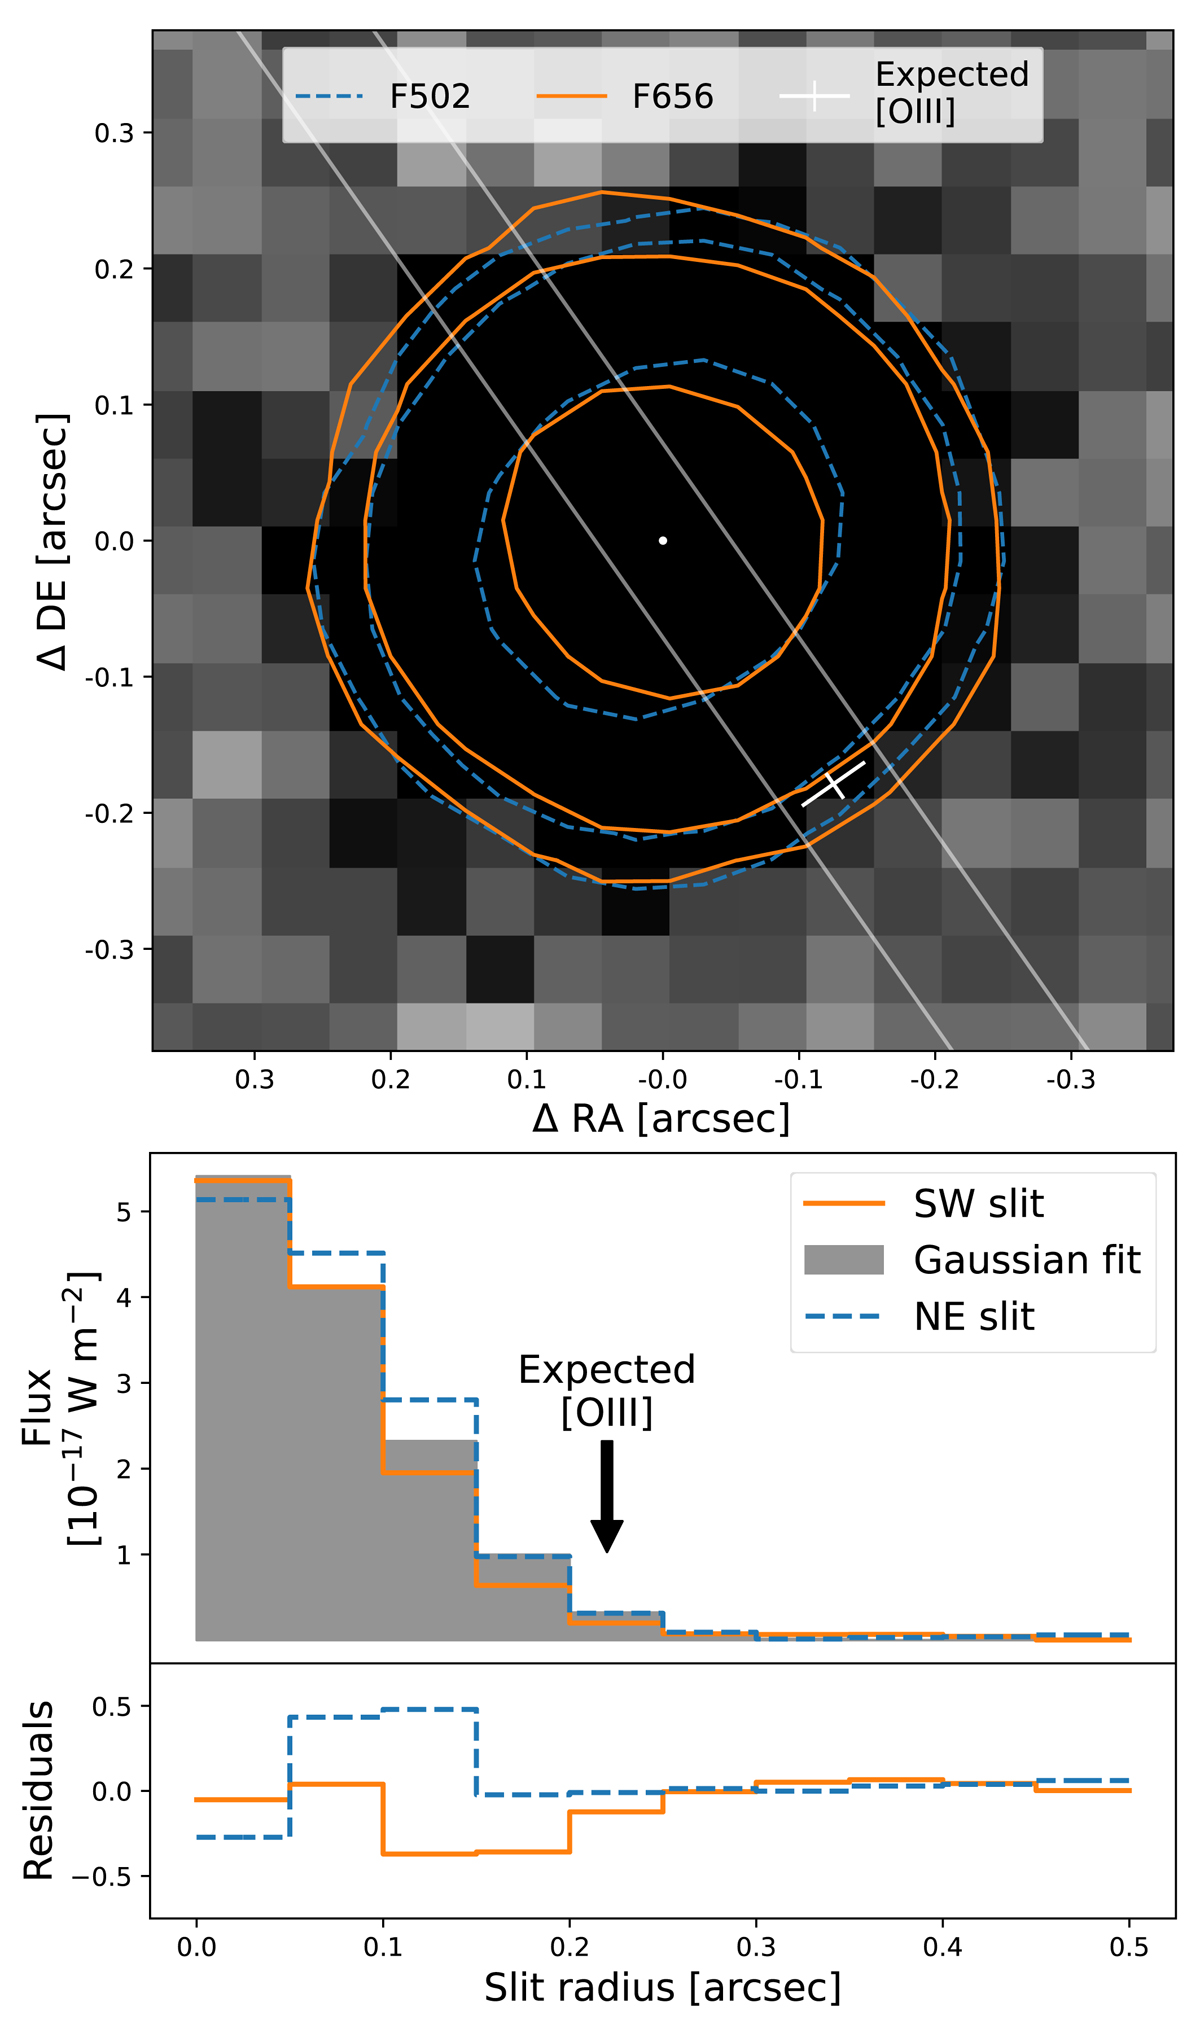
Flux distribution of the HST data. The top plot shows the contours of the F656 and the F502 flux overlaid on the F656 image, representing fractions of 0.5, 0.1, and 0.05 of the respective central fluxes. The F502 data have been corrected for the small instrumental shift (see text). The white cross marks the expected position of the outer [O III] ejecta, with the sizes of the marker denoting the uncertainty in the radial distance and angle. The lines mark the area used to derive the radial profile shown in the middle plot. Dashed and solid lines represent the flux in the two directions towards and away from the expected outer ejecta, while the filled area indicates a Gaussian fit. The bottom plot presents the respective residuals to that fit.
Current usage metrics show cumulative count of Article Views (full-text article views including HTML views, PDF and ePub downloads, according to the available data) and Abstracts Views on Vision4Press platform.
Data correspond to usage on the plateform after 2015. The current usage metrics is available 48-96 hours after online publication and is updated daily on week days.
Initial download of the metrics may take a while.