Fig. 6.
Download original image
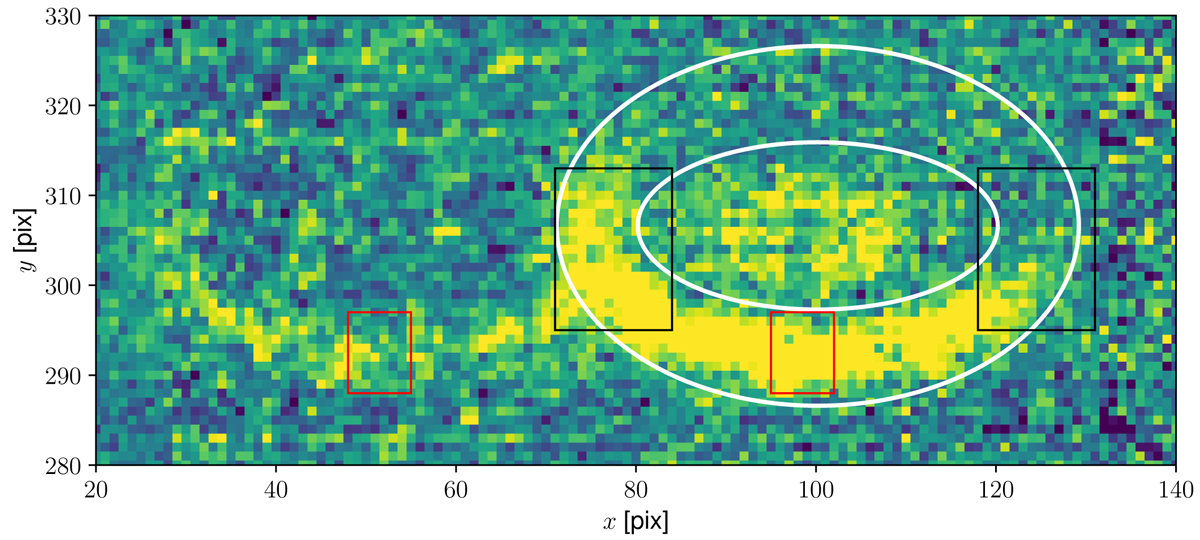
Areas used for the flux calculation on the example of the [O III] lines in the continuum–subtracted spectrum. The ellipses represent the region used for the elliptical aperture photometry of the outer [O III]b line. The two red rectangles mark the areas of comparison between the outer [O III]a,b lines. The black rectangles indicate the region of overlap of the [O III]a line with the outer [O III]b material and the corresponding region for [O III]b. For details see the text.
Current usage metrics show cumulative count of Article Views (full-text article views including HTML views, PDF and ePub downloads, according to the available data) and Abstracts Views on Vision4Press platform.
Data correspond to usage on the plateform after 2015. The current usage metrics is available 48-96 hours after online publication and is updated daily on week days.
Initial download of the metrics may take a while.