Fig. 5.
Download original image
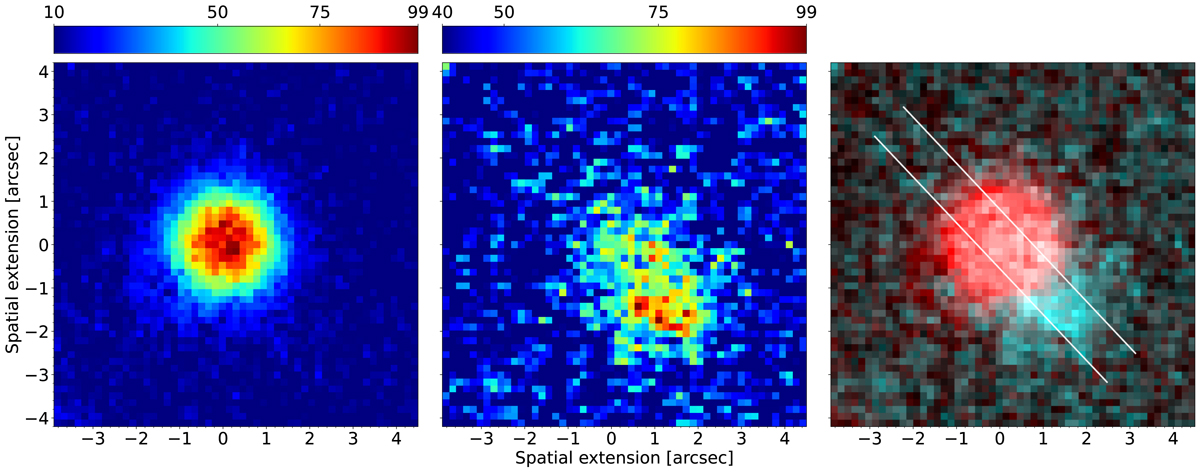
Narrow-band images in the usual orientation with east to the left and north to the top. The left and middle plots show the Hα and the [O III] data, respectively. In both images, the sky background has been subtracted and the data have been normalised to a value of 100 with respect to their individual maximum values. The right plot shows a composite image, where the Hα data are marked in red and the [O III] data in blue. The white lines indicate the width and angle of the slit in the spectroscopic data. For all images, the zero point of the coordinate system was set to the centre of the Hα emission.
Current usage metrics show cumulative count of Article Views (full-text article views including HTML views, PDF and ePub downloads, according to the available data) and Abstracts Views on Vision4Press platform.
Data correspond to usage on the plateform after 2015. The current usage metrics is available 48-96 hours after online publication and is updated daily on week days.
Initial download of the metrics may take a while.