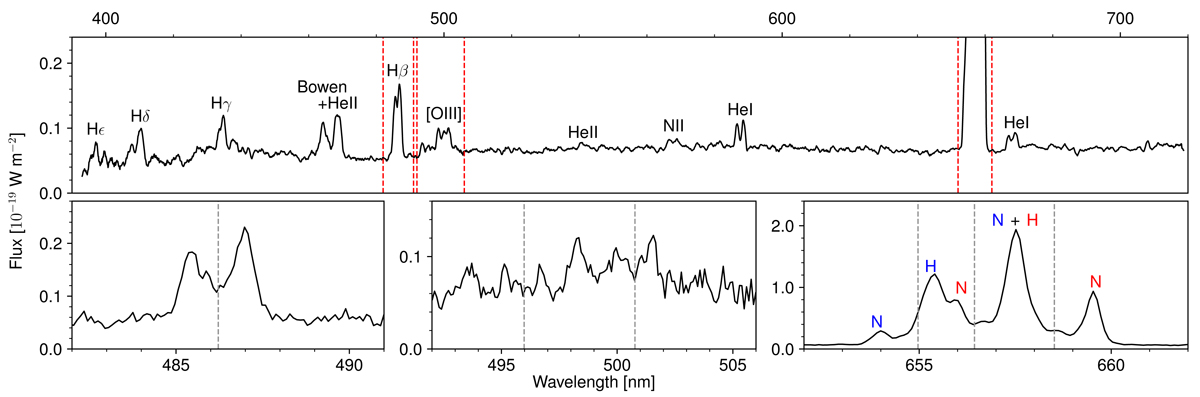
Fig. 4.
Download original image
Extracted spectrum. The upper plot presents the full available wavelength range. The data were smoothed with a filter of 7 pixels in width. Identified emission lines are labelled. The lower plots show close-ups of the unsmoothed data in the regions indicated in the upper plot by the two vertical dashed lines (Hβ, the two [O III] lines, and Hα, plus the two [N II] lines, from left to right). The vertical dashed lines indicate the nominal centres (rest wavelength plus systemic velocity) of the respective emission lines. In the rightmost plot, the letters mark the blueshifted and redshifted [N II]a,b and Hα emission line components of the inner shell, and the colour of the letters symbolises the direction of the shift.
Current usage metrics show cumulative count of Article Views (full-text article views including HTML views, PDF and ePub downloads, according to the available data) and Abstracts Views on Vision4Press platform.
Data correspond to usage on the plateform after 2015. The current usage metrics is available 48-96 hours after online publication and is updated daily on week days.
Initial download of the metrics may take a while.