Fig. 8
Download original image
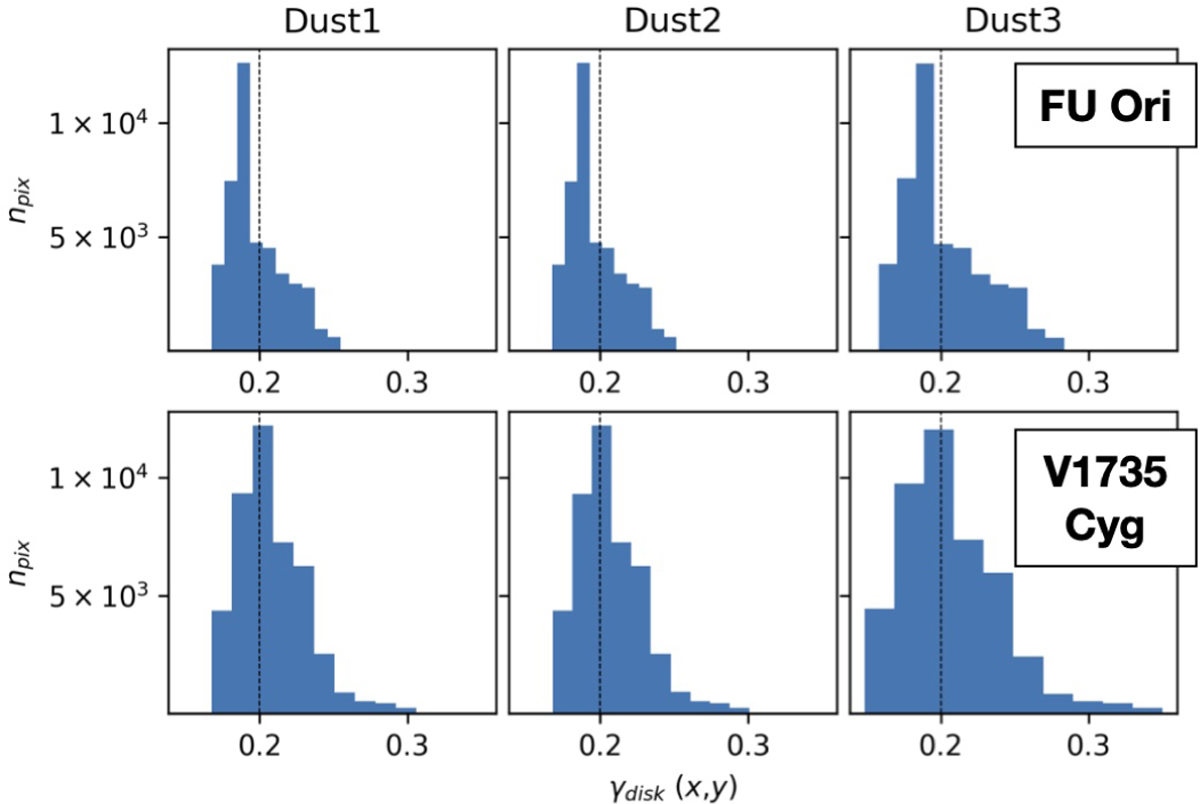
Histograms for γdisk for the case with a star as the central illuminating source. The vertical axis shows the number of pixels for each bin. The vertical dashed line in each panel shows the representative constant ![]() .
.
Current usage metrics show cumulative count of Article Views (full-text article views including HTML views, PDF and ePub downloads, according to the available data) and Abstracts Views on Vision4Press platform.
Data correspond to usage on the plateform after 2015. The current usage metrics is available 48-96 hours after online publication and is updated daily on week days.
Initial download of the metrics may take a while.