Fig. 6
Download original image
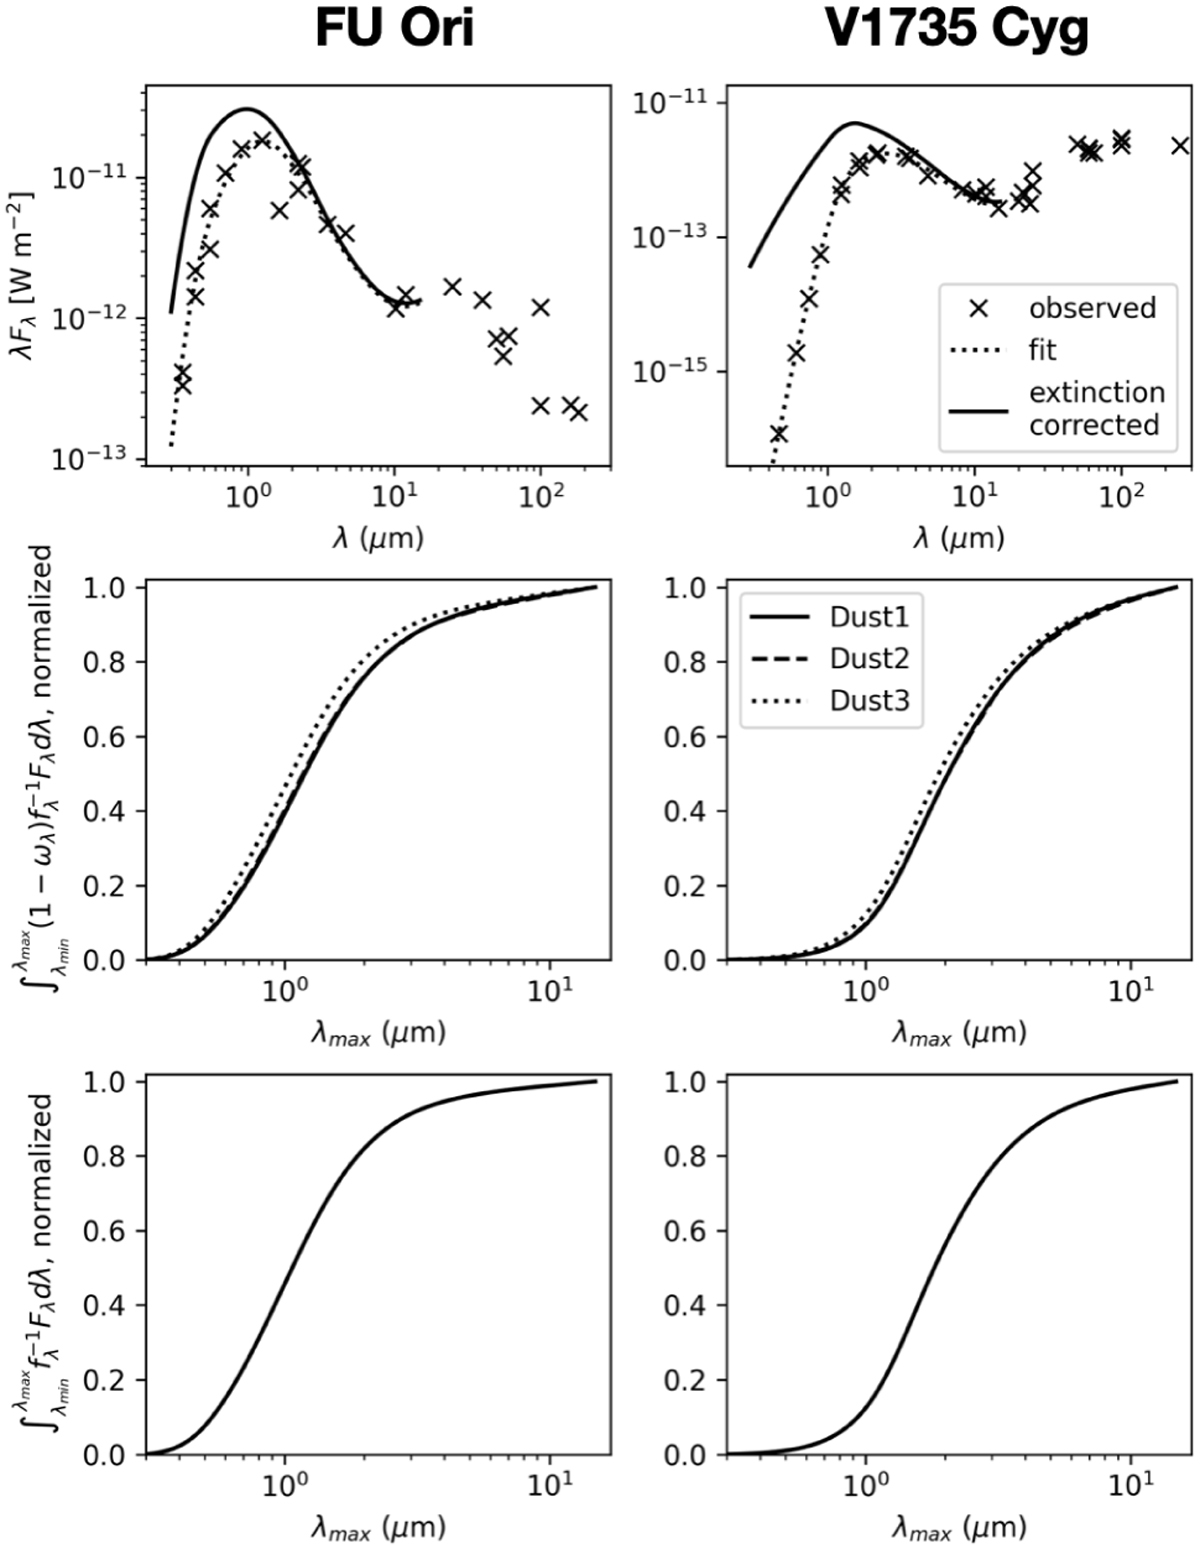
Radiation from the central sources. Top: The spectral energy distributions. The crosses show the observations; the dotted curves show fittings; and the solid curves show those corrected for foreground extinction. Middle: Cumulative fraction of the integrations used in Eqs. (38), (40) and (45). The horizontal axis is the maximum wavelength for integration up to λ=15 μm. Bottom: Same as the middle panels but for the integrations used in Eq. (39).
Current usage metrics show cumulative count of Article Views (full-text article views including HTML views, PDF and ePub downloads, according to the available data) and Abstracts Views on Vision4Press platform.
Data correspond to usage on the plateform after 2015. The current usage metrics is available 48-96 hours after online publication and is updated daily on week days.
Initial download of the metrics may take a while.