Fig. A.3
Download original image
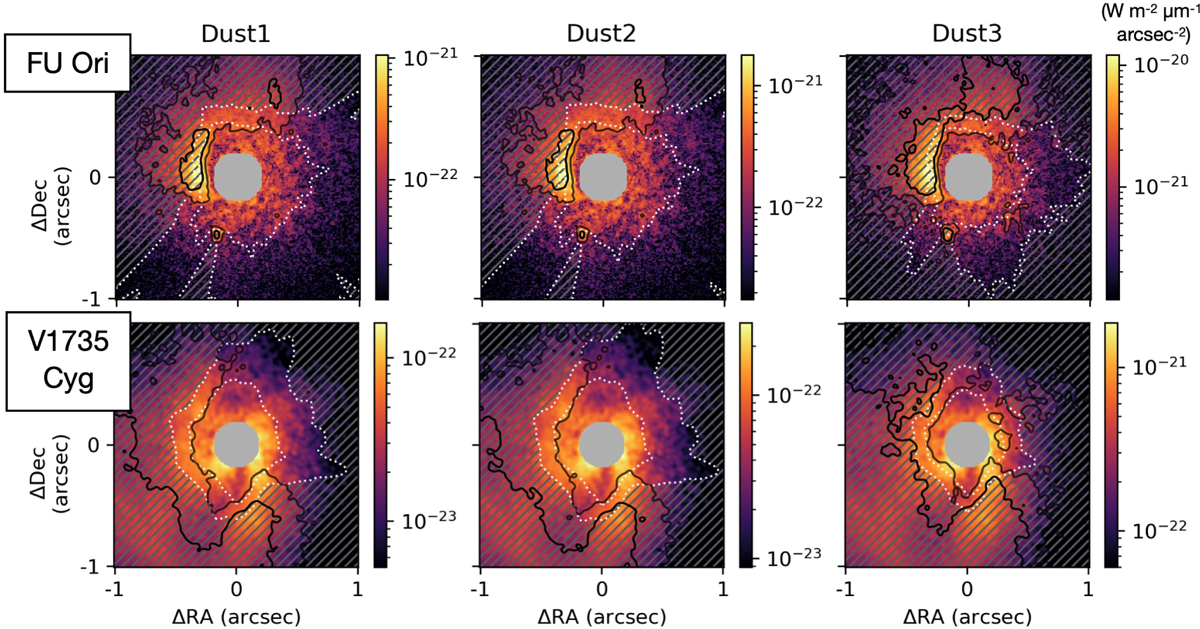
Same as the bottom panles of Figs. 13 and 14 but for ![]() . As for these figures, the white dotted contours in the upper panels are for zdisk/r=0.5; the white dotted contours in the lower panels are for τr=0.35 and 0.7; and the black solid contours in the lower panels are for τl=0.35 and 0.7. The regions with τr>0.7 and τl>0.7 are hatched in the bottom panels.
. As for these figures, the white dotted contours in the upper panels are for zdisk/r=0.5; the white dotted contours in the lower panels are for τr=0.35 and 0.7; and the black solid contours in the lower panels are for τl=0.35 and 0.7. The regions with τr>0.7 and τl>0.7 are hatched in the bottom panels.
Current usage metrics show cumulative count of Article Views (full-text article views including HTML views, PDF and ePub downloads, according to the available data) and Abstracts Views on Vision4Press platform.
Data correspond to usage on the plateform after 2015. The current usage metrics is available 48-96 hours after online publication and is updated daily on week days.
Initial download of the metrics may take a while.