Fig. 7
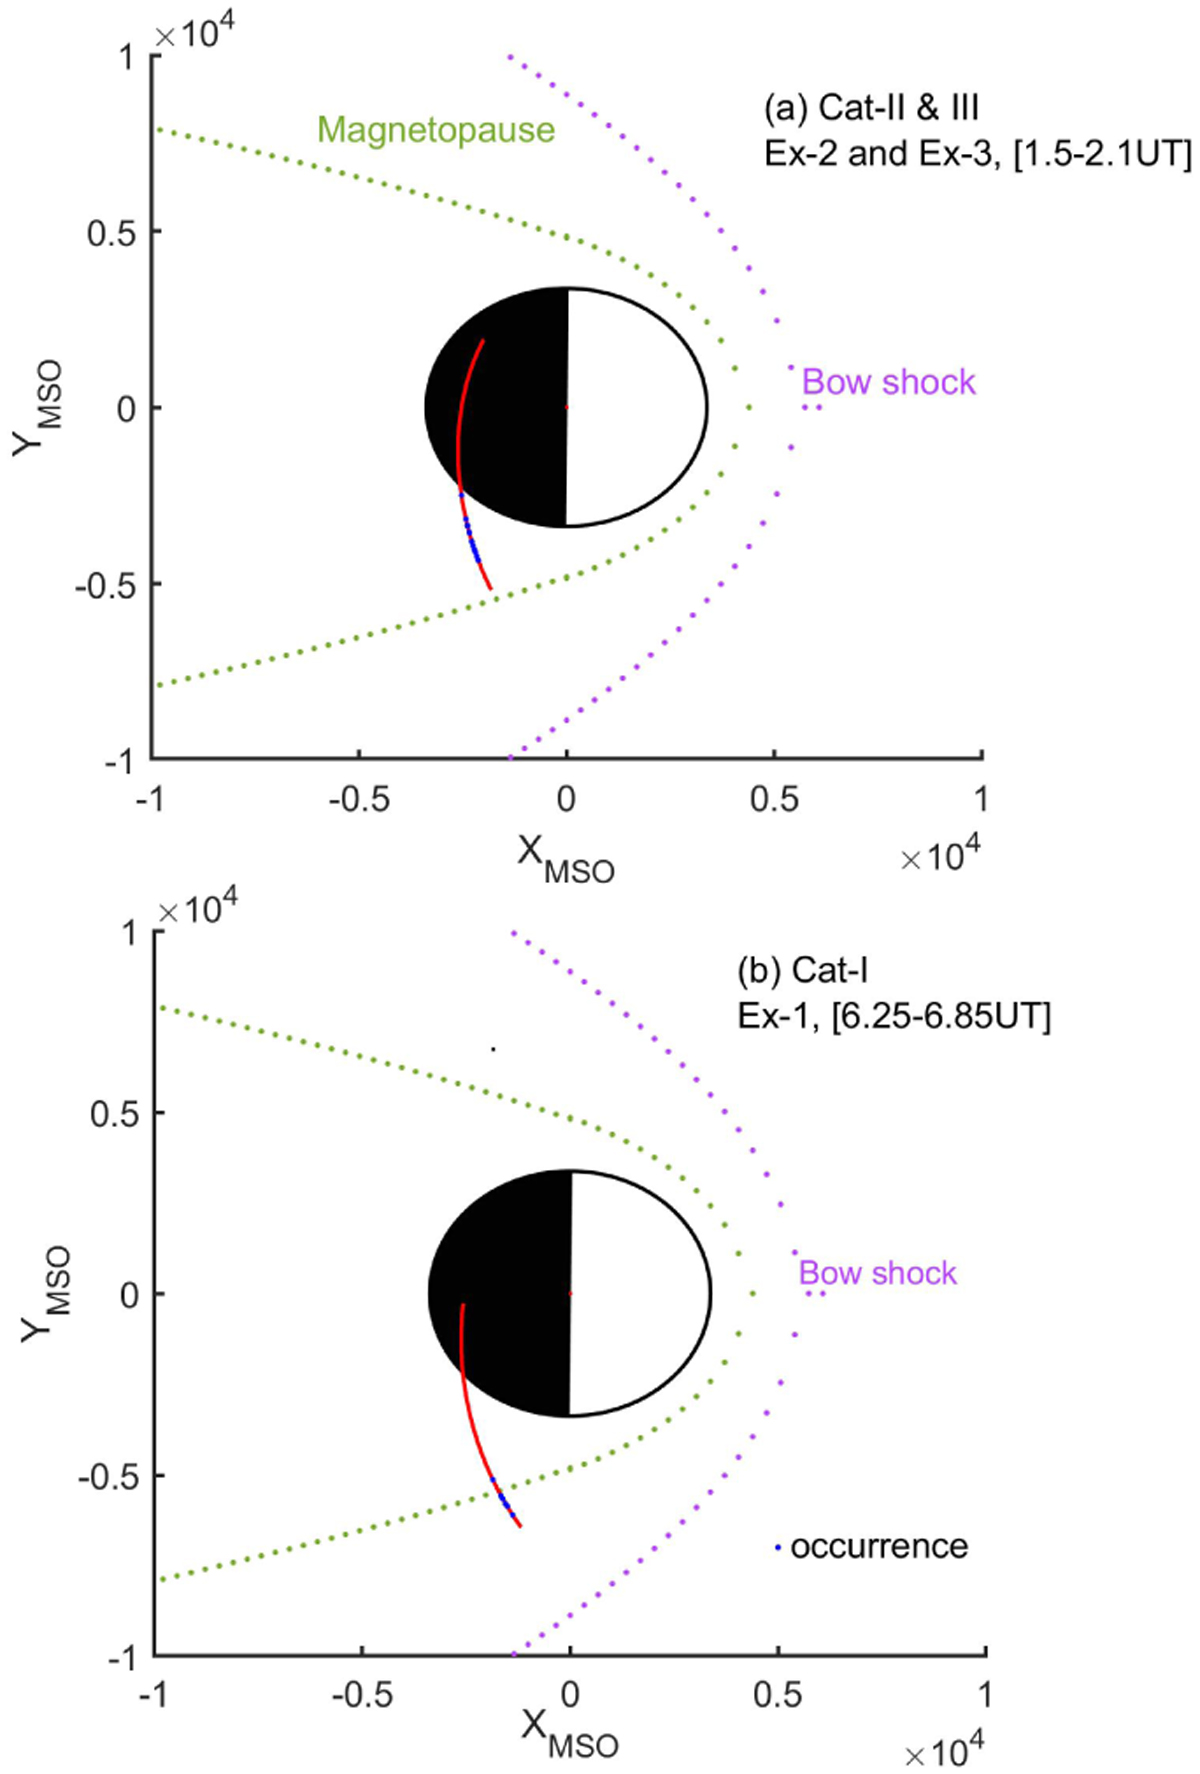
Download original image
MAVEN location and wave occurrence region. The trajectories of MAVEN spacecraft (red) in XY plane during time interval (a) 1.5–2.1 UT and (b) 6.25–6.85 UT around the Mars are shown. The modeled bow-shock and magnetopause boundary, obtained by using Trotignon et al. (2006), are shown. The occurrence of high-frequency fluctuations are marked with blue dots.
Current usage metrics show cumulative count of Article Views (full-text article views including HTML views, PDF and ePub downloads, according to the available data) and Abstracts Views on Vision4Press platform.
Data correspond to usage on the plateform after 2015. The current usage metrics is available 48-96 hours after online publication and is updated daily on week days.
Initial download of the metrics may take a while.