Fig. 5
Download original image
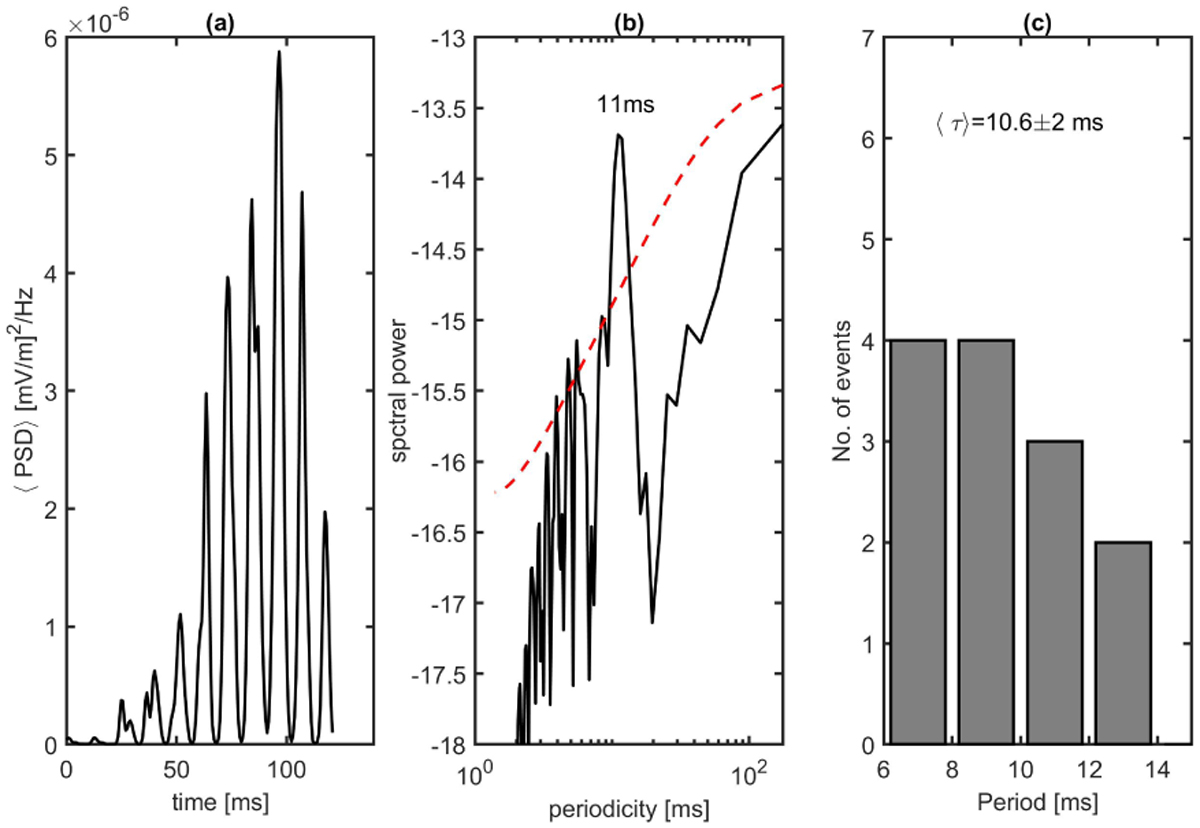
Periodicities observed in broadband-type waves. Panel a shows average spectrogram power 〈PSD〉 as a function of time for event no. 5 shown in Fig. 2 (broadband-type wave, category II). Here, time is in milliseconds after the start time 01:55:46:200 hh:mm:ss:mss (in UT); panel b shows Fourier transform of average spectrogram power as a function of periods; and panel c shows the distribution of dominant repetitive periods observed in 13 broadband-type events of category II and III. The dominant repetitive period is estimated to be 10.6±2 ms. The red dashed line in panel b indicate the 90% statistical significance level for the Fourier spectra.
Current usage metrics show cumulative count of Article Views (full-text article views including HTML views, PDF and ePub downloads, according to the available data) and Abstracts Views on Vision4Press platform.
Data correspond to usage on the plateform after 2015. The current usage metrics is available 48-96 hours after online publication and is updated daily on week days.
Initial download of the metrics may take a while.