Fig. 4
Download original image
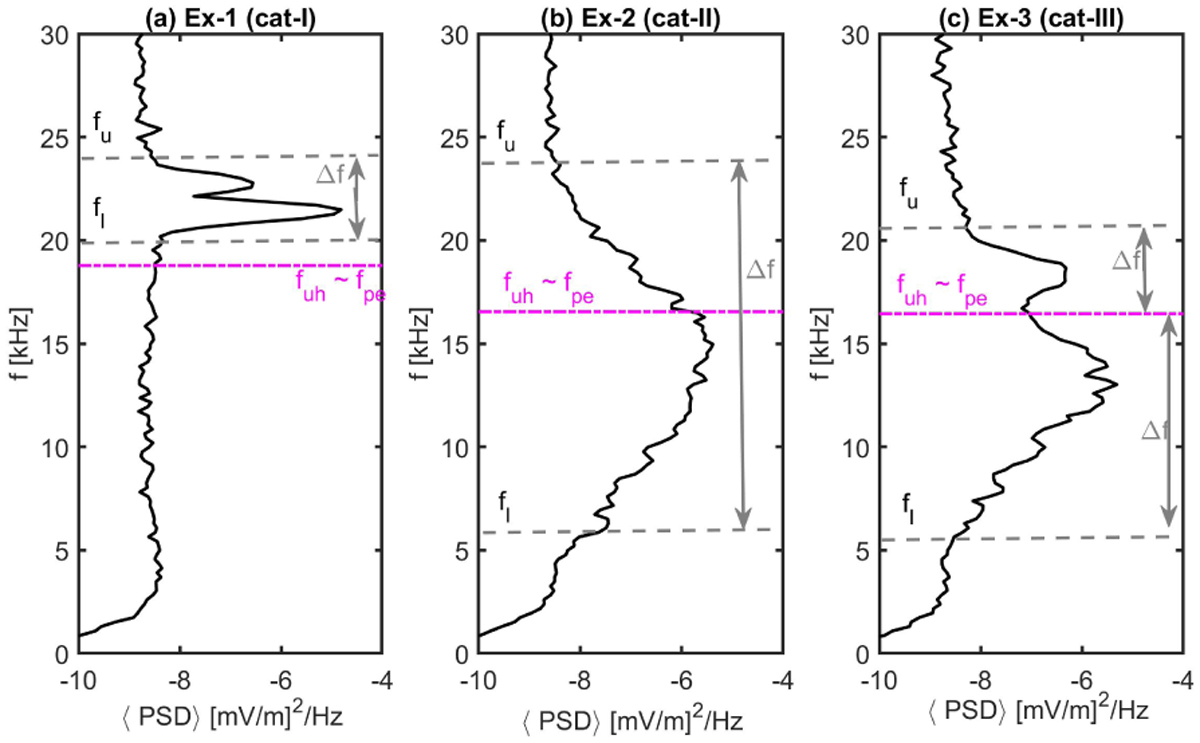
Wave frequency as a function of average spectrogram power. (a) example 1 (category I), (b) example 2 (category II), and (c) example 3 (category III). The grey horizontal dashed lines indicate the lower and upper frequency limits for the observed wave. The magenta color dashed-dotted lines in each panel indicate the upper-hybrid (≈ electron plasma) frequency for each respective time of observation. For each wave mode, the frequency extent (or width), ∆f, is marked in each panel.
Current usage metrics show cumulative count of Article Views (full-text article views including HTML views, PDF and ePub downloads, according to the available data) and Abstracts Views on Vision4Press platform.
Data correspond to usage on the plateform after 2015. The current usage metrics is available 48-96 hours after online publication and is updated daily on week days.
Initial download of the metrics may take a while.