Fig. 1
Download original image
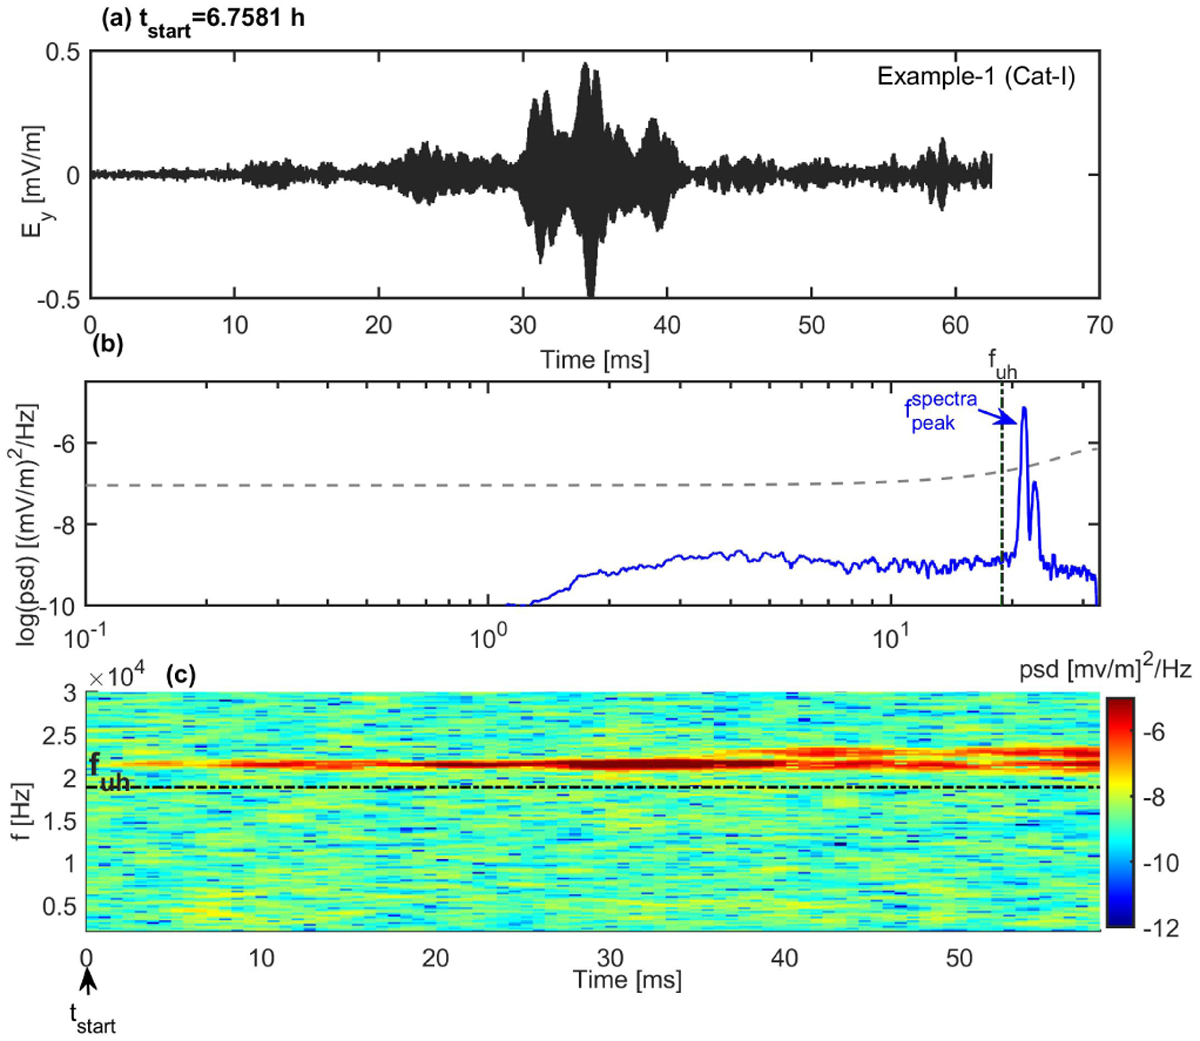
Example of narrowband-type (category I, event no. 17) high-frequency wave. Electric field recorded by LPW instrument on MAVEN spacecraft is plotted as a function of time in milliseconds after the start time of this event, tstart = 06:45:29:160 hh:mm:ss:mss (in UT), fast Fourier spectra of these electric field variations and its spectrograms (frequency-time representation) are plotted in panels a, b, and c, respectively. The black dashed-dotted vertical line in panel b and horizontal line in panel c indicate the upper-hybrid wave estimated from ambient plasma parameters. The spectral peak is well above the 90% statistical significance marked by dashed grey line in panel b. Here, the length of electric field data is 62.5 ms.
Current usage metrics show cumulative count of Article Views (full-text article views including HTML views, PDF and ePub downloads, according to the available data) and Abstracts Views on Vision4Press platform.
Data correspond to usage on the plateform after 2015. The current usage metrics is available 48-96 hours after online publication and is updated daily on week days.
Initial download of the metrics may take a while.