Open Access
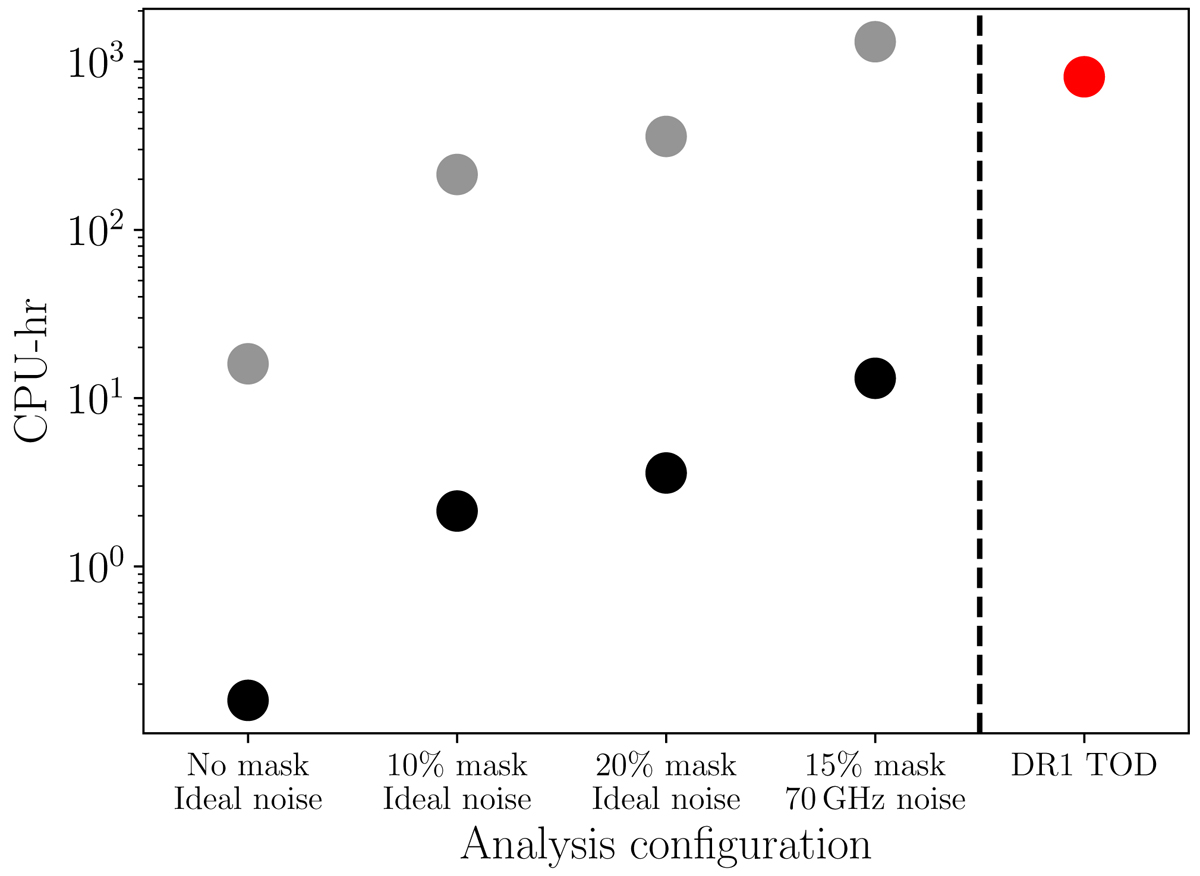
Fig. 8.
Download original image
CPU-hours per accepted sample. The black dots are the costs per sample, while the gray dots are the costs per effective sample, i.e., normalized by the correlation length of the chain. This is compared to the 812 CPU-hours to generate one single end-to-end sample of DR1 COSMOGLOBEPlanck LFI and WMAP channels, in red.
Current usage metrics show cumulative count of Article Views (full-text article views including HTML views, PDF and ePub downloads, according to the available data) and Abstracts Views on Vision4Press platform.
Data correspond to usage on the plateform after 2015. The current usage metrics is available 48-96 hours after online publication and is updated daily on week days.
Initial download of the metrics may take a while.