Fig. 7.
Download original image
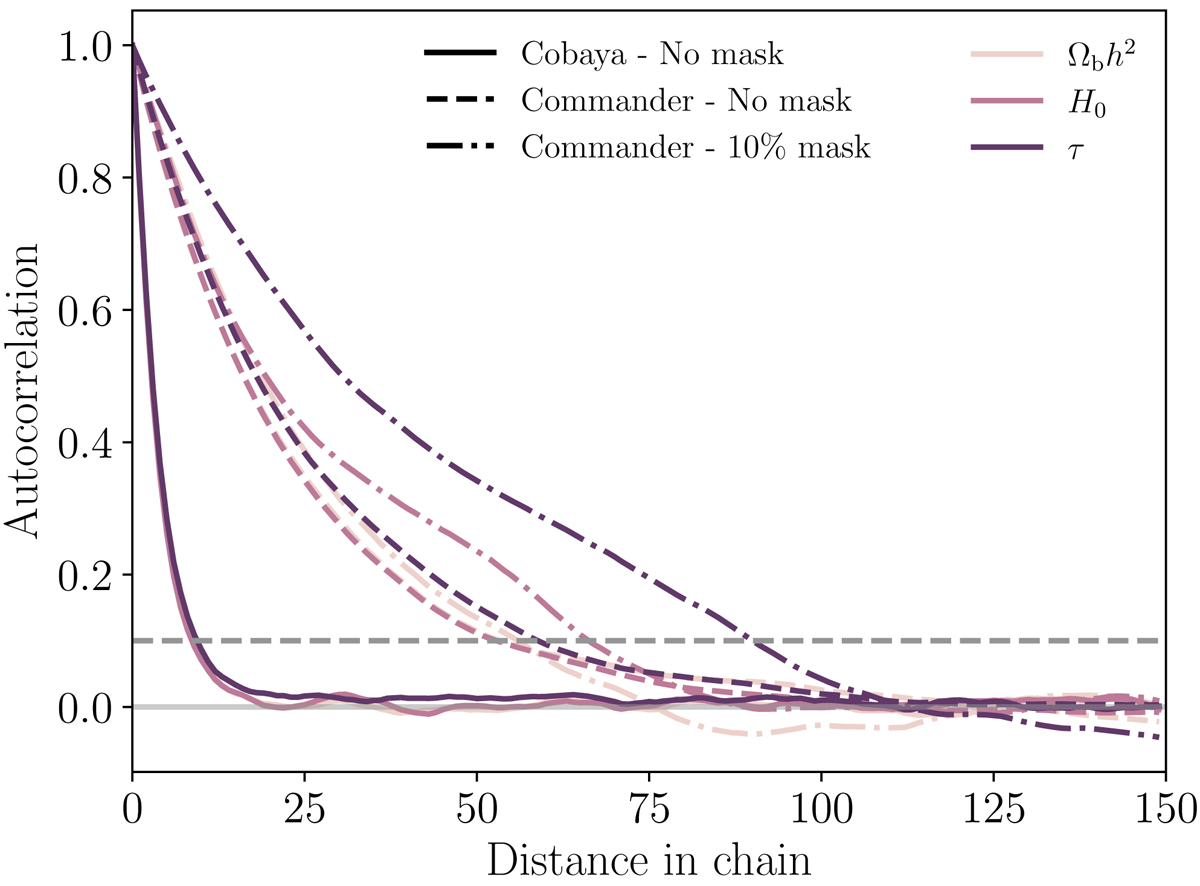
Markov chain autocorrelation functions for Cobaya (solid lines) and Commander3 for a set of typical cosmological parameters. Dashed and dot-dashed lines show Commander3 results for the full-sky case and the 10 % mask case, respectively. The horizontal dashed gray line indicates an autocorrelation of 0.1, which we use to define the overall correlation length.
Current usage metrics show cumulative count of Article Views (full-text article views including HTML views, PDF and ePub downloads, according to the available data) and Abstracts Views on Vision4Press platform.
Data correspond to usage on the plateform after 2015. The current usage metrics is available 48-96 hours after online publication and is updated daily on week days.
Initial download of the metrics may take a while.