Fig. 2.
Download original image
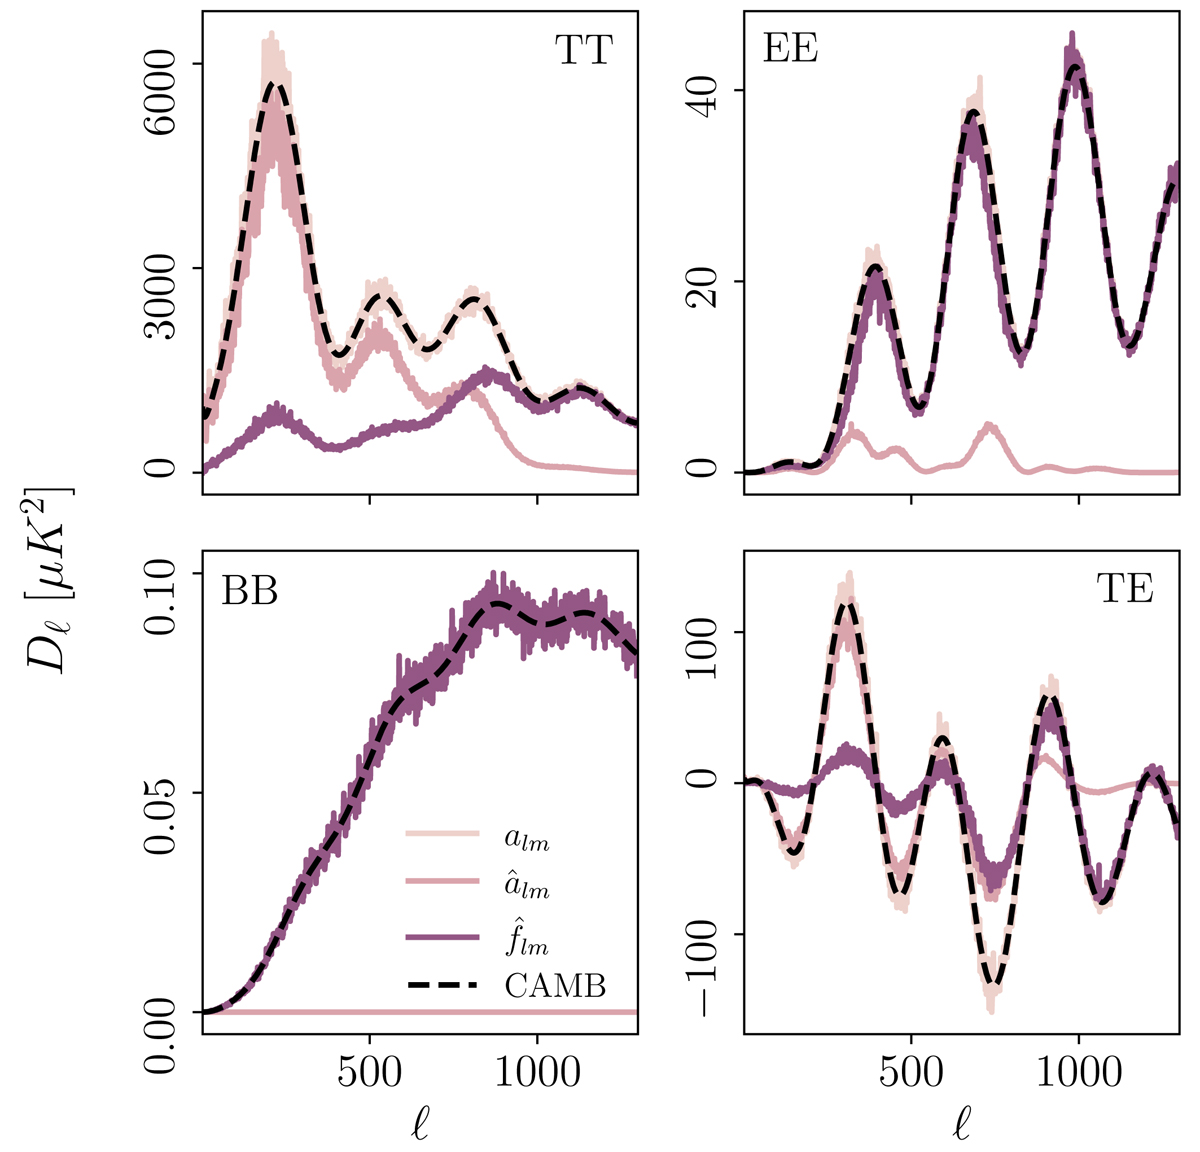
Angular power spectra for each of the constrained realization maps shown in Fig. 1. The ΛCDM cosmological model corresponding to θ is shown as a dashed black line, while the colored curves show (from dark to light) spectra for the fluctuation map, the mean field map, and the full constrained realization. Note that in the fully noise-dominated cases, such as the entire B-mode power spectrum and all high multipoles, the fluctuation term ![]() and the CMB estimate aℓm have nearly identical power spectra by design.
and the CMB estimate aℓm have nearly identical power spectra by design.
Current usage metrics show cumulative count of Article Views (full-text article views including HTML views, PDF and ePub downloads, according to the available data) and Abstracts Views on Vision4Press platform.
Data correspond to usage on the plateform after 2015. The current usage metrics is available 48-96 hours after online publication and is updated daily on week days.
Initial download of the metrics may take a while.