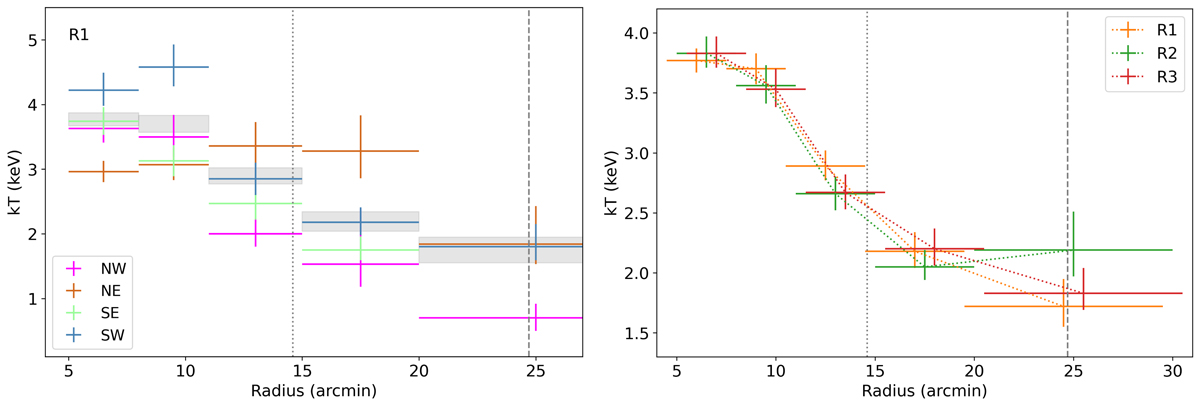
Fig. 7.
Download original image
Projected temperature profiles. Left: First round results (R1), using only the Suzaku data. The grey shaded regions denote the azimuthally-averaged temperature measurements. The dotted and dashed lines show the radius of r500 and r200 respectively. Right: Comparison between different rounds of azimuthally averaged measurements. All three rounds of spectra were extracted from the same annuli but shifted by 0.5′ in this plot for illustration purpose. The abundance is fixed to 0.3 beyond r500 (Werner et al. 2013; Urban et al. 2017).
Current usage metrics show cumulative count of Article Views (full-text article views including HTML views, PDF and ePub downloads, according to the available data) and Abstracts Views on Vision4Press platform.
Data correspond to usage on the plateform after 2015. The current usage metrics is available 48-96 hours after online publication and is updated daily on week days.
Initial download of the metrics may take a while.