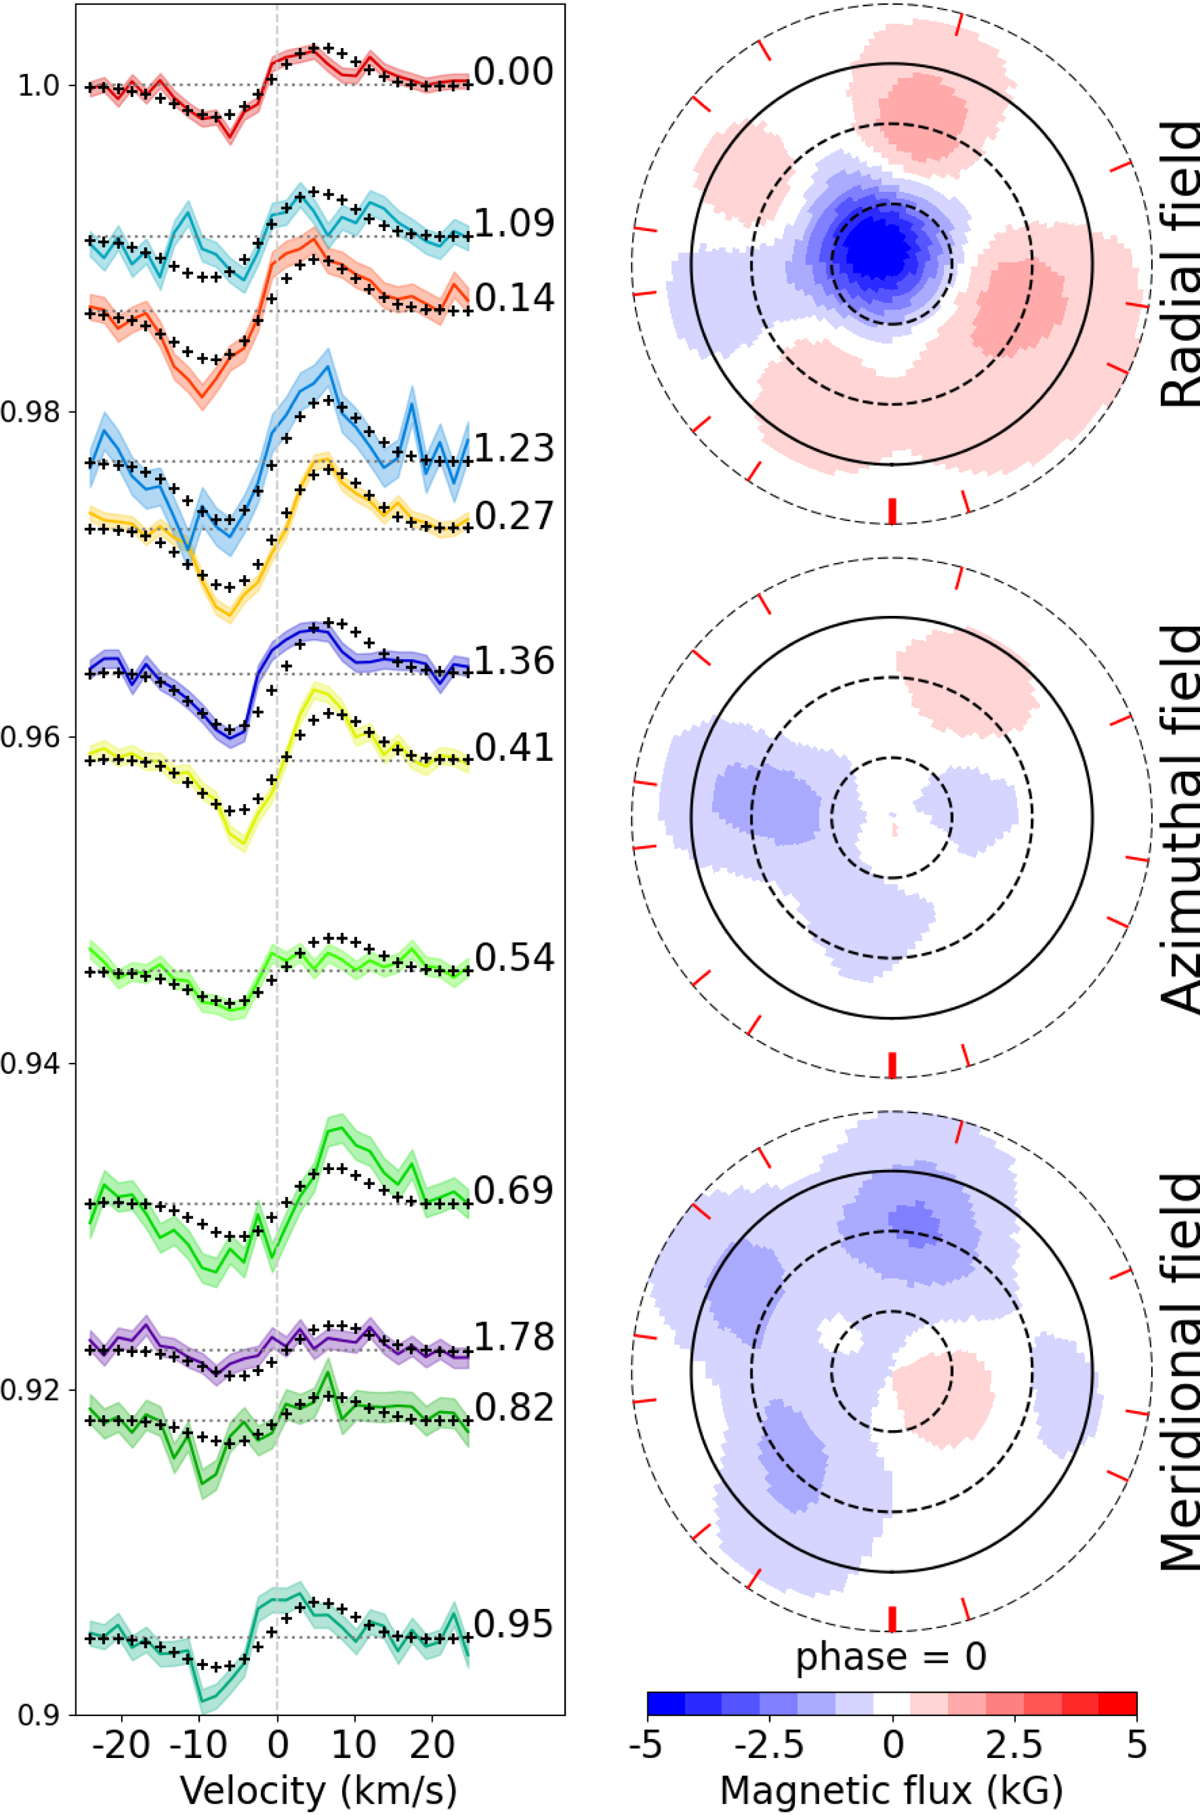
Fig. 11.
Download original image
Polar projection of the magnetic maps (right) reconstructed from the LSD V observations (left, colored lines). The black crosses overplotted on the LSD profiles show the reconstructed V, to the right of which the cycle number and phase are indicated. The red ticks surrounding each map show the observed phases clockwise, starting from the south. The dashed black circles show colatitudes of 27° (i), 63° (90−i) and 117° (90+i). The solid black line shows the equator.
Current usage metrics show cumulative count of Article Views (full-text article views including HTML views, PDF and ePub downloads, according to the available data) and Abstracts Views on Vision4Press platform.
Data correspond to usage on the plateform after 2015. The current usage metrics is available 48-96 hours after online publication and is updated daily on week days.
Initial download of the metrics may take a while.