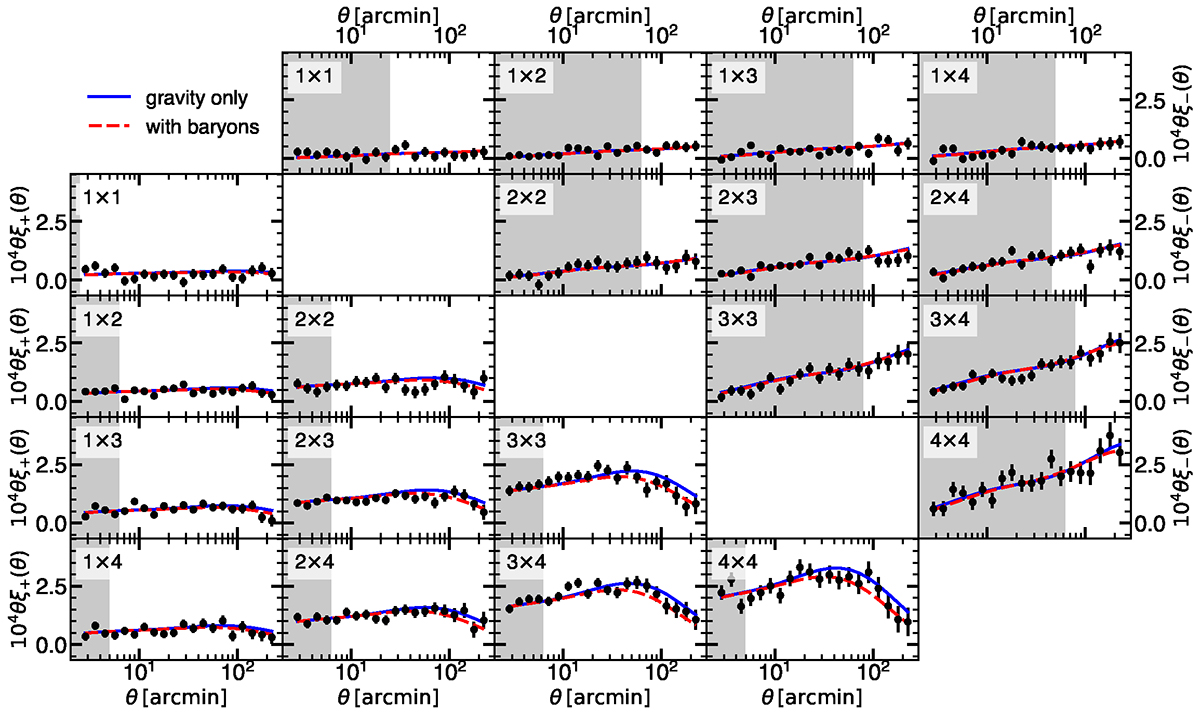
Fig. 1.
Download original image
Cosmic shear correlation functions, ξ±, measured by DES Y3 in four redshift bins, for a total of 400 data points. In the lower left corner we display ξ+, and in the upper right corner, we show ξ−, both multiplied by 104θ for clarity. The corresponding redshift bins are indicated in each subplot. The grey bands show the scales that were discarded in the analysis carried out by the DES Collaboration. We display the best-fitting models that we obtained using the full data vector when considering only gravity (solid blue line), and additionally considering baryonic processes (dashed red line).
Current usage metrics show cumulative count of Article Views (full-text article views including HTML views, PDF and ePub downloads, according to the available data) and Abstracts Views on Vision4Press platform.
Data correspond to usage on the plateform after 2015. The current usage metrics is available 48-96 hours after online publication and is updated daily on week days.
Initial download of the metrics may take a while.