Fig. 9
Download original image
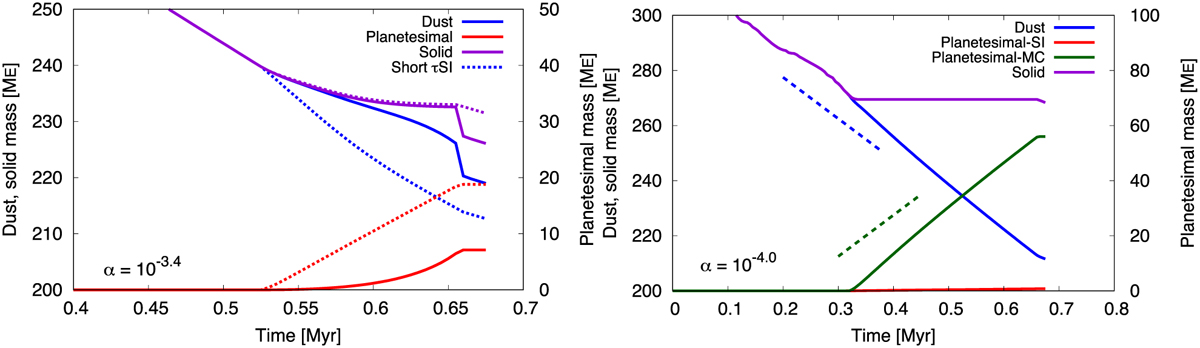
Same as Fig. 3 but with τSI = 103TK. The left and right panels represent the profiles with α = 10−3.4 and 10−4, respectively. In the left panel, the profiles with τSI = 10 yr are also plotted as the dotted curves. All planetesimals form by streaming instability when α = 10 −3.4. In the right panel, we plot the mass of the planetesimals formed by streaming instability (red) and by mutual collision (green). The blue dashed line represents the slope of the dust mass assuming constant loss with ![]() . The green dashed line represents the slope of the cumulative mass of the dust drifting into the planetesimal formation place with the same mass flux.
. The green dashed line represents the slope of the cumulative mass of the dust drifting into the planetesimal formation place with the same mass flux.
Current usage metrics show cumulative count of Article Views (full-text article views including HTML views, PDF and ePub downloads, according to the available data) and Abstracts Views on Vision4Press platform.
Data correspond to usage on the plateform after 2015. The current usage metrics is available 48-96 hours after online publication and is updated daily on week days.
Initial download of the metrics may take a while.