Fig. 3
Download original image
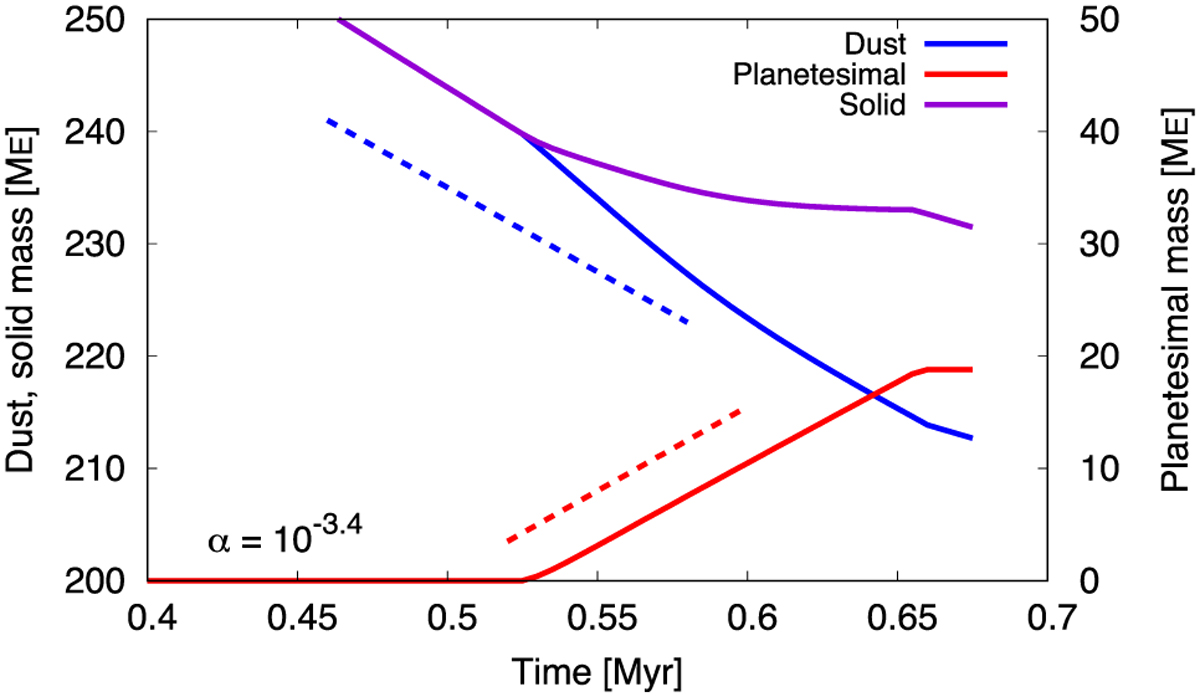
Time evolution of the dust, planetesimal, and solid (sum of the dust and planetesimals) mass with τSI = 10 yr and α = 10−34. The blue, red, and purple curves represent the profiles of the dust, planetesimal, and solid, respectively. The dashed blue line represents the slope of the dust mass assuming constant loss with ![]() . The red dashed line represents the slope of the cumulative mass of the dust drifting into the planetesimal formation place with the same mass flux.
. The red dashed line represents the slope of the cumulative mass of the dust drifting into the planetesimal formation place with the same mass flux.
Current usage metrics show cumulative count of Article Views (full-text article views including HTML views, PDF and ePub downloads, according to the available data) and Abstracts Views on Vision4Press platform.
Data correspond to usage on the plateform after 2015. The current usage metrics is available 48-96 hours after online publication and is updated daily on week days.
Initial download of the metrics may take a while.