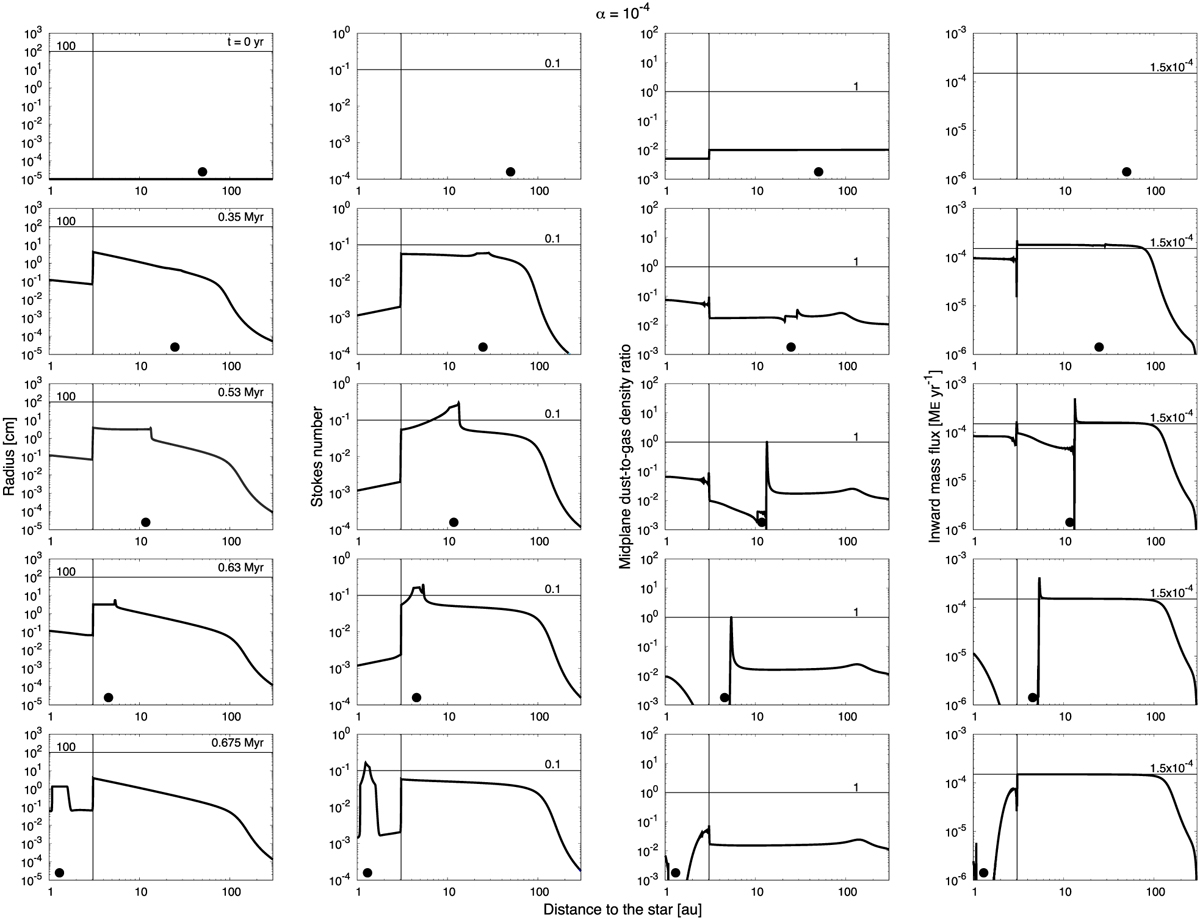
Fig. 2
Download original image
Time evolution of the detailed profiles of dust with α = 10−3.4. The first to fourth columns from the left represent the radial profiles of the radius, Stokes number, midplane dust-to-gas density ratio, and inward flux of mass, respectively. The first to fifth rows from the top represent the profiles at t = 0, 0.35, 0.53, 0.63, and 0.75 Myr, respectively. The horizontal lines represent the critical or important values of each profile. The vertical lines represent the position of the snowline. The circles represent the orbital positions of the planet.
Current usage metrics show cumulative count of Article Views (full-text article views including HTML views, PDF and ePub downloads, according to the available data) and Abstracts Views on Vision4Press platform.
Data correspond to usage on the plateform after 2015. The current usage metrics is available 48-96 hours after online publication and is updated daily on week days.
Initial download of the metrics may take a while.